
Alar
Alar Aab
Recently Published
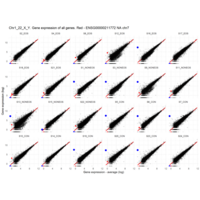
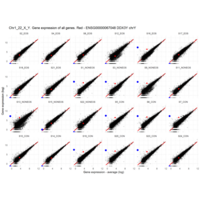
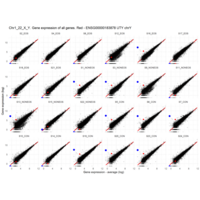
Plot - ENSG00000211772
T-CELL RECEPTOR BETA CHAIN CONSTANT REGION 2; TRBC2
is the proof that some samples are contaminated with blood cells
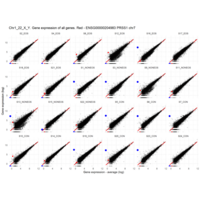
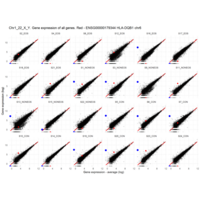
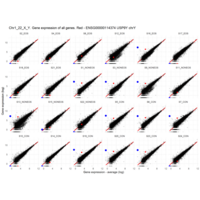
Plot - ENSG00000110347
matrix metallopeptidase 12 (macrophage elastase)
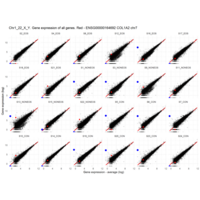
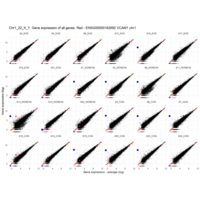
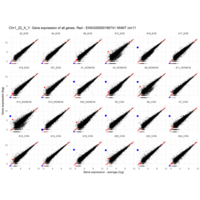
Plot - ENSG00000213318
very interesting - Chr16, but RNA is up only in males
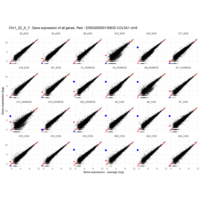
for women - Produced only during pregnancy and is involved in stimulating lactation, fetal growth and metabolism. Does not interact with GHR but only activates PRLR through zinc-induced dimerization.
Protein
Chorionic somatomammotropin hormone 2
Gene
CSH2
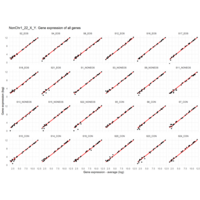


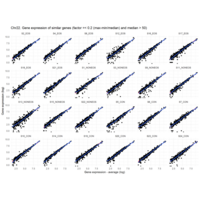
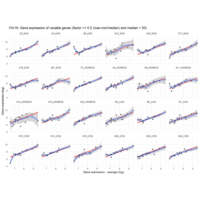
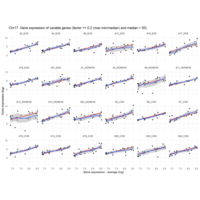
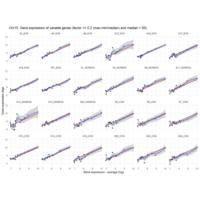
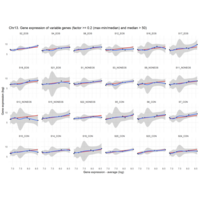
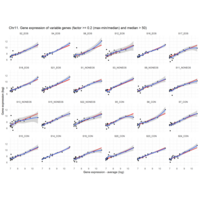
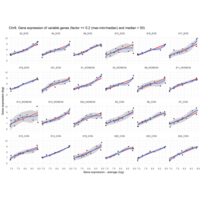
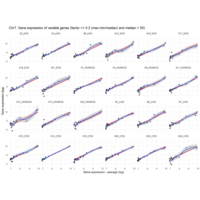
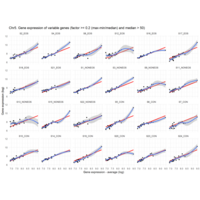
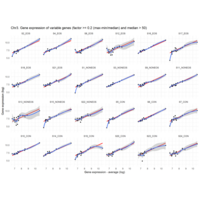

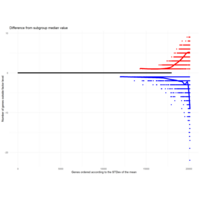
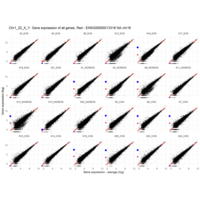
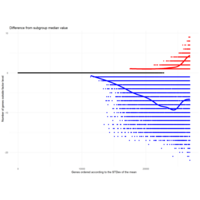
Difference from subgroup median value
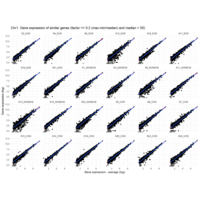
I removed genes which have less than 50 reads in every subgroup
MoreThan<-2.5
LessThan<-0.1
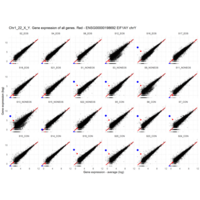
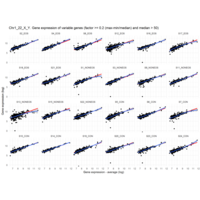
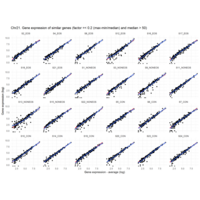
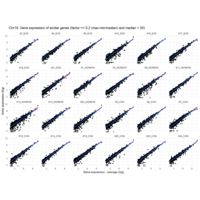
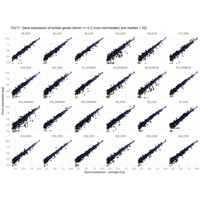
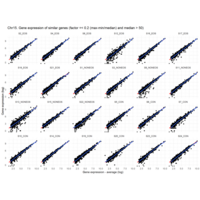
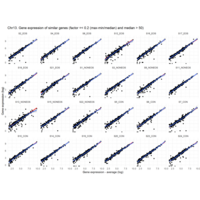
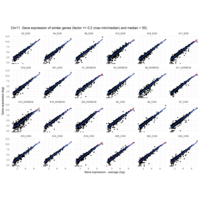
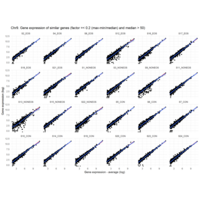
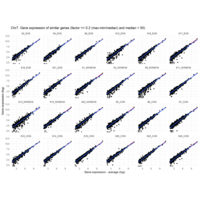
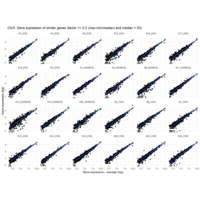
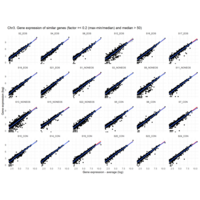
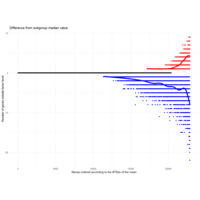
Difference from subgroup median value
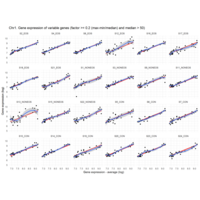
I removed genes which have less than 10 reads in every subgroup
EOS_values1<-EOS_values[rowSums(EOS_values)>50|rowSums(NONEOS_values)>50|rowSums(CON_values)>10,]
NONEOS_values1<-NONEOS_values[rowSums(EOS_values)>10|rowSums(NONEOS_values)>10|rowSums(CON_values)>10,]
CON_values1<-CON_values[rowSums(EOS_values)>50|rowSums(NONEOS_values)>10|rowSums(CON_values)>10,]
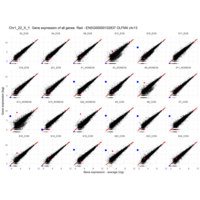
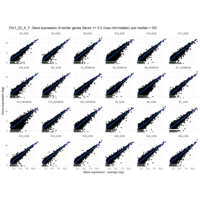
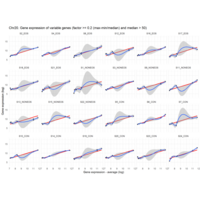
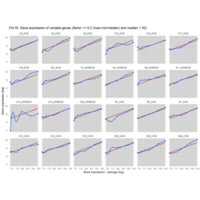
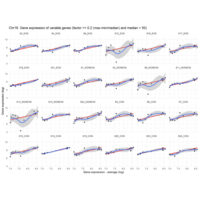
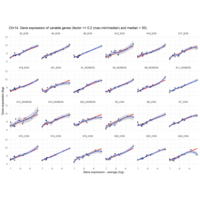
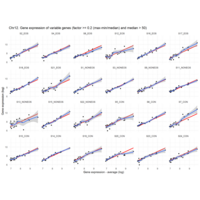
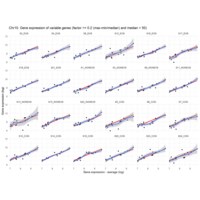
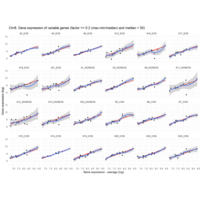
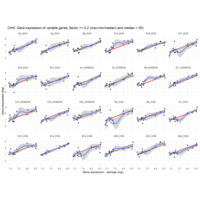
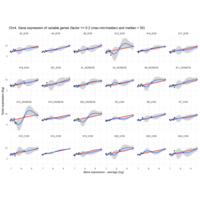
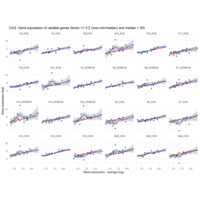
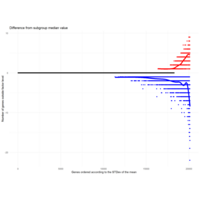
Difference from subgroup median value
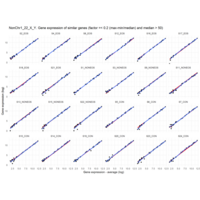
I removed genes which have less than 20 reads in every subgroup
EOS_values1<-EOS_values[rowSums(EOS_values)>20|rowSums(NONEOS_values)>20|rowSums(CON_values)>20,]
NONEOS_values1<-NONEOS_values[rowSums(EOS_values)>20|rowSums(NONEOS_values)>20|rowSums(CON_values)>20,]
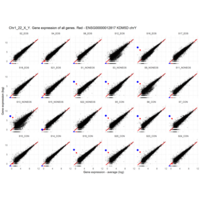
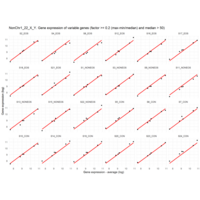
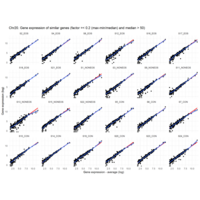
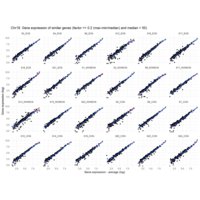
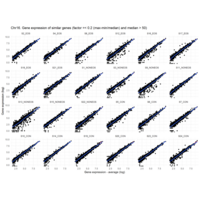
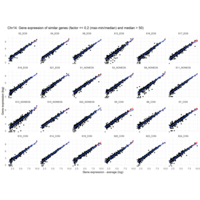
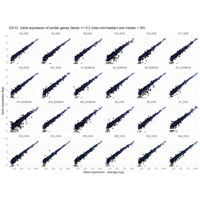
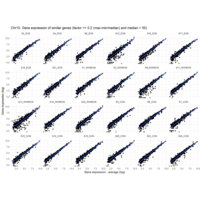
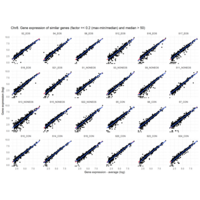
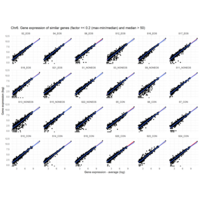
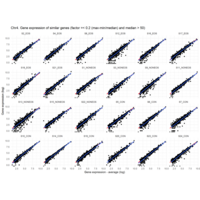
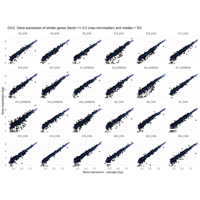
Difference from subgroup median value
I removed genes which have less than 50 reads in every subgroup
EOS_values1<-EOS_values[rowSums(EOS_values)>50|rowSums(NONEOS_values)>50|rowSums(CON_values)>50,]
NONEOS_values1<-NONEOS_values[rowSums(EOS_values)>50|rowSums(NONEOS_values)>50|rowSums(CON_values)>50,]
CON_values1<-CON_values[rowSums(EOS_values)>50|rowSums(NONEOS_values)>50|rowSums(CON_values)>50,]
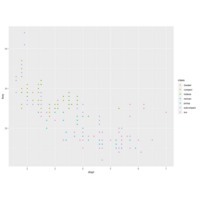
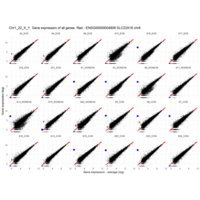
Plot
Just learning