
BIN_FANG
BIN FANG
Recently Published

CLT Web APP (Data Science Course-9 Project)
This web app is built to verify Central Limit Theorem, one of the most important theorem in the area of statistics, by simulation and some following analysis of the data. This web app may be very useful for teaching in statistics classes, especially to show students vividly how CLT works for various origins of data. R shiny is used to develop CLT Web APP.

Google Stock Index (Presentation)
This Project is to create interactive plot to analyze Google's branch stock index from 2015 to the most recent date of 2017 (2017-04-17). The historical Google stock index data can be found from Google Finance. This file is created for presentation.
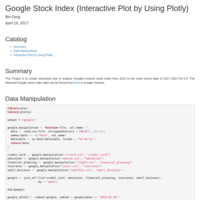
Google Stock Index (Time Series Plot by Using Plotly)
This Project is to create interactive plot to analyze Google's branch stock index from 2015 to the most recent date of 2017 (2017-04-17) by using Plotly. The historical Google stock index data can be found from Google Finance.

Hospitals in AZ
Interactive Map of AZ Hospitals in Cooperation with ADHS: Clustered circle markers grouped (colored) by Parent Organization; Pop-ups showing facility name, telephone number and vendor name.
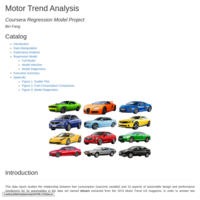
Motor Trend Analysis
This data report studies the relationship between fuel consumption (outcome) and 10 aspects of automobile design and performance for 32 automobiles in the data set named mtcars extracted from the 1974 Motor Trend US magazine, in order to answer two questions:
1. Is an automatic or manual transmission better for MPG?
2. What is the MPG difference between automatic and manual transmissions?
Linear regression model is used to explore these questions.
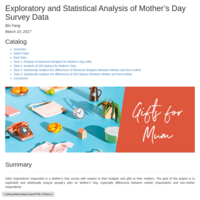
Exploratory Analysis of Mother’s Day Survey Data
2404 respondents responded in a Mother’s Day survey with respect to their budgets and gifts to their mothers. The goal of this project is to explorarily anayze people’s plan on Mother’s Day, especially differences between mother respondents and non-mother respondents.
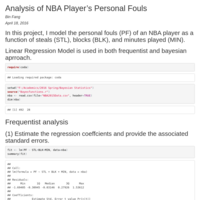
Analysis of NBA Players' Personal Fouls with Linear Regression Model
Both frequentist and Bayesian Approach are applied.
Data Analysis Project Summary
This file covers the link to most of the data analysis projects that I have done.
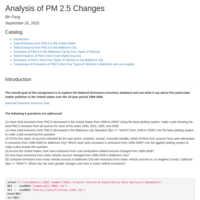
Analysis of PM 2.5 Changes
The overall goal of this assignment is to explore the National Emissions Inventory database and see what it say about fine particulate matter pollution in the United states over the 10-year period 1999–2008.

Simulation of Central Limit Theorem with Exponential Samples
In this project I will verify the Central Limit Theorem with simulated exponential samples. I will do a thousand simulations and investigate the sample of averages of 40 exponentials, by comparing the sample mean, variance and distribution with theoretical counterpoints respectively.
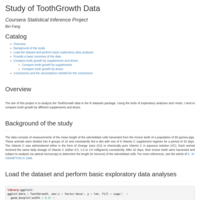
Study of ToothGrowth Data
The aim of this project is to analyze the ToothGrowth data in the R datasets package. Using the tools of exploratory analyses and t-tests, we tend to compare tooth growth by different supplements and doses.
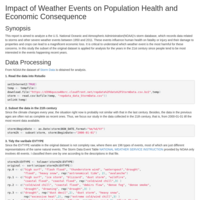
Impact of Weather Events on Population Health and Economic Consequence
This report is aimed to analyze a the U.S. National Oceanic and Atmospheric Administration(NOAA)’s storm database, which records data related to storms and other severe weather events between 1950 and 2011. These events influence human health on fatality or injury and their damage to properties and crops can lead to a magnificent economic loss. It is critical to understand which weather event is the most harmful for these concerns. In this study the subset of the original dataset is applied for analysis for the years in the 21st century since people tend to be most interested in the events happening recent years.