
Eynowd
Geoff Skellams
Recently Published
GSTextPredictor
A slide presentation outlining my text prediction web app.
Capstone Project Milestone Report
This report shows details of the initial data exploration of the raw text files provided.

Shiny Assignment
This presentation is the pitch for a Shiny Application, which can be found at https://eynowd.shinyapps.io/ShinyAssignment/
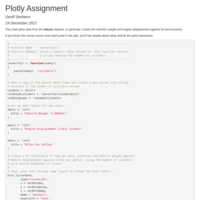
Plotly Assignment
This report creates a 3D scatterplot showing data from the mtcars dataset.

Major Canberra Attractions
An interactive map of Canberra's parliamentary triangle, created using RMarkdown and Leaflet, for the second assignment for the "Developing Data Products" Coursera course.
Human Casuality Rates and Damage Estimates Caused By Severe Weather Events
In this report, I analyse the NOAA Storm Database in order to determine which types of severe weather events have the greatest human casualty rates, and which event types cause the greatest amounts of property damage. The data in the dataset runs from 1950 to November 2011. By standardising the event type descriptions, allowing for proper data grouping, I was able to determine that the highest casualty rates – combining both fatalities and injuries – are caused by tsunamis, followed by ice storms and hurricanes. The highest rates of property damage were caused by storm surges, followed by hurricanes.