
JMFlin
Janne Flinck
Recently Published


App
Dev
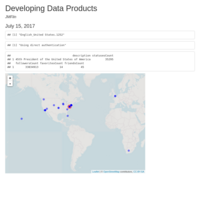
Developing ata Products - Maps
Leaflet

Presentation with Plotly
R JHU Plotly
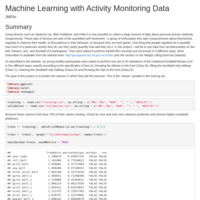
Machine Learning with Activity Monitoring Data
In this project, I will be to use data from accelerometers on the belt, forearm, arm, and dumbell of 6 participants. They were asked to perform barbell lifts correctly and incorrectly in 5 different ways. More information is available from the website here: http://groupware.les.inf.puc-rio.br/har (see the section on the Weight Lifting Exercise Dataset).
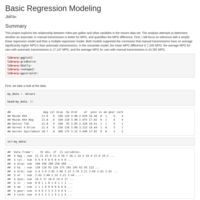
Basic Regression Modeling
This project explores the relationship between miles-per-gallon and other variables in the mtcars data set. The analysis attempts to determine whether an automatic or manual transmission is better for MPG, and quantifies the MPG difference.

Twitter Analysis
Text analysis of Trump's tweets.
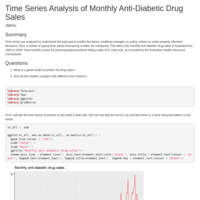
Time Series Analysis of Monthly Anti-Diabetic Drug Sales
This data is for monthly anti-diabetic drug sales in Australia from 1992 to 2008. Total monthly scripts for pharmaceutical products falling under ATC code A10, as recorded by the Australian Health Insurance Commission.
Statistical Inference on Tooth Growth Data
Analyzing the effect of Vitamin C on tooth growth in Guinea pigs. The purpose of the this data analysis is to analyze the ToothGrowth data set by comparing the guinea tooth growth by supplement and dose. First, I will do exploratory data analysis on the data set. Then I will do the comparison with confidence intervals/p-values in order to make conclusions about the tooth growth.
Weather Data of Portoover 2014
The data set consists of daily records of several meteorological parameters, measured in the city of Portoover the year of 2014.

U.S. National Oceanic and Atmospheric Administration’s (NOAA) Storm Data
This project involves exploring the U.S. National Oceanic and Atmospheric Administration’s (NOAA) storm database.
Activity Monitoring Data
This task makes use of data from a personal activity monitoring device. This device collects data at 5 minute intervals through out the day. The data consists of two months of data from an anonymous individual collected during the months of October and November, 2012 and include the number of steps taken in 5 minute intervals each day.