
Kwarizmi
Mario M. Martinez
Recently Published
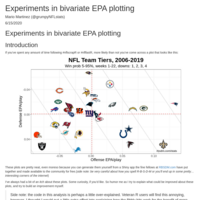
Experiments in Bivariate EPA Plotting
Plotting 2 EPA means against each other is.. unsatisfying. In this code-through, I try to do a little better. I use depth medians to measure the central tendency of the (Off_EPA, Def_EPA) duple, then build a plot that uses depth medians plus deviation estimates to express the confidence interval of the estimate.
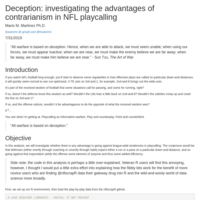
Deception - An nflscrapR study
Is there some advantage for NFL teams to pass when they "should" run, and to run when they "should" pass? Let's take a look!