Recently Published
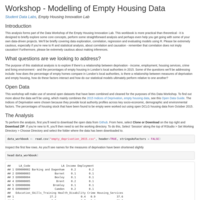
Workshop - Modelling of Empty Housing Data
This analysis forms part of the Data Workshop of the Empty Housing Innovation Lab. This workbook is more practical than theoretical - it is designed to briefly explore some core concepts, perform some straightforward analysis and perhaps even help you get going with some of your own data-driven projects. We’ll be briefly covering data exploration, correlation, regression and model evaluation using R. Please be extremely cautious, especially if you’re new to R and statistical analysis, about correlation and causation - remember that correlation does not imply causation! Furthermore, please be extremely cautious about making inferences.
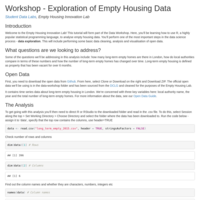
Workshop - Exploration of Empty Housing Data
This tutorial will form part of the Data Workshop of the Empty Housing Innovation Lab. Here, you’ll be learning how to use R to analyse empty housing data. You’ll perform one of the most important steps in the data science process - data exploration and communication. This will include performing some basic data cleaning, analysis and visualisation of open data.
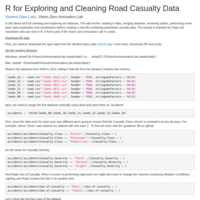
R for Exploring and Cleaning Road Casualty Data
In this demo we'll be cleaning and exploring our datasets. This will involve: reading in data, merging datasets, renaming values, performing some basic data exploration and visualisation before creating a new file containing pedestrian casualty data.
The tutorial is intended for Data Lab Volunteers who are new to R. It forms part of the Vision Zero Innovation Lab in Leeds.
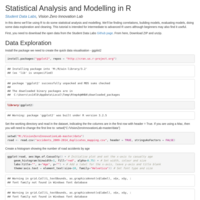
Statistical Analysis and Modelling in R
In this demo we’ll be using R to do some statistical analysis and modeling. We’ll be finding correlations, building models, evaluating models, doing some data exploration and cleaning.
This tutorial is intended for intermediate to advanced R users although beginners may also find it useful. It was created as part of the Vision Zero Innovation Lab.
Mapping Cycling Crashes in R
In this practical demo we’ll be creating a dot density map to show the location of bicycle casualties in Leeds from 2009-2014.
This is intended for beginner and intermediate R users, who may or may not have some experience in data visualisation or mapping. This has been created as part of the Vision Zero Innovation Lab.