
aam044
Alexey Maloletkin
Recently Published

What is the next word??
Final presentation for coursera capstone project to predict next word in sentence.
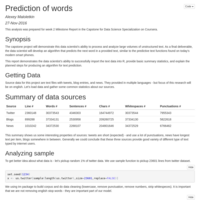
Prediction of words
Provide source data analysis

The Consumer Price Index and Inflation Analysis App
Presentation made as part of Data Product Coursera course using RStudion Presenter
The Consumer Price Index and Inflation Analysis App
Presentation made as part of Data Product Coursera course using RStudion Presenter
CPI and Inflation Analysis App
There is pitch presentation for Consumer Price Index and Inflation Analysis App.
Done as a part of Data Products course on coursera.com
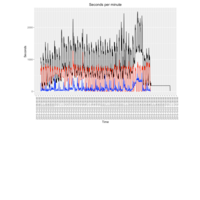
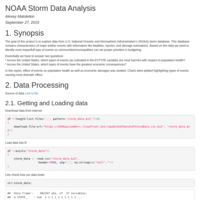
NOAA Storm Data Analysis
The goal of this project is to explore data from U.S. National Oceanic and Atmospheric Administration’s (NOAA) storm database. This database contains characteristics of major wether events with information like fatalities, injuries, and damage estimations. Based on this data we need to identify most impactful type of events so communities/municipalities can set proper priorities in budgeting.
Essentially we have to answer two questions:
* Across the United States, which types of events (as indicated in the EVTYPE variable) are most harmful with respect to population health?
* Across the United States, which types of events have the greatest economic consequences?
In this report, effect of events on population health as well as economic damages was studied. Charts were plotted highlighting types of events causing most dramatic effect.