
bradleyboehmke
Brad Boehmke
Recently Published
Week 1 Group Work
Turn your homework into an ioslide presentation.
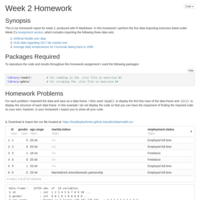
Week 2 Homework
This is an HTML R Markdown document that provides a reference for week 2's homework for students in University of Cincinnati's Data Wrangling with R class.
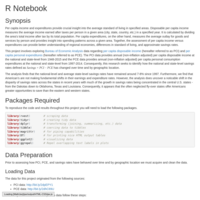
Example Final Project for UC Data Wrangling Class
This analysis provides an example final project for students in the University of Cincinnati's Data Wrangling with R class.

Data Wrangling with R: Week 1 Homework
This is an HTML R Markdown document that provides a reference for week 1's homework for students in University of Cincinnati's Data Wrangling with R class.
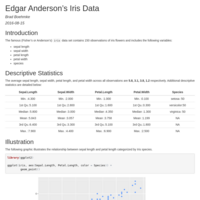
Edgar Anderson's Iris Data
This R Markdown tutorial is an example provided to my R programming students who are tasked to try replicate the document on their own.
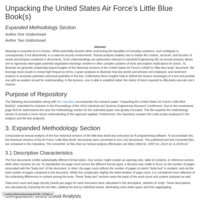
Unpacking the United States Air Force’s Little Blue Book(s)
This repository accompanies the research paper “Unpacking the United States Air Force’s Little Blue Book(s)” submitted for inclusion in the Proceedings of the 2016 Industrial and Systems Engineering Research Conference. Due to the constrained page limit for submissions this year the methodology section for the submitted paper was greatly truncated. This file expands the methodology section to provide a more robust understanding of the approach applied. Furthermore, this repository contains the code scripts employed in the analysis and the text analyzed.
Data Wrangling in R
Data processing with dplyr & tidyr
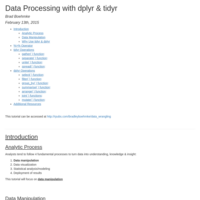
Data Processing with dplyr & tidyr
This is a tutorial I provided at Wright State University on data wrangling with the dplyr & tidyr packages.
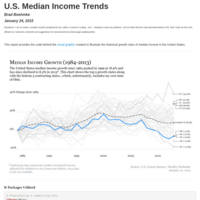
Median Income Growth Trends
Provides a tutorial for the visual graphic illustrating the growth trends of median incomes in the United States.
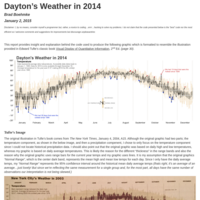
Creating the Dayton Weather Visualization
Provides a step-by-step approach to creating the Dayton temperature visualization, which mirrors the illustration in Edward Tufte's classic book Visual Display of Quantitative Information

Word Prediction App
This presentation highlights a word prediction algorithm and Shiny application product
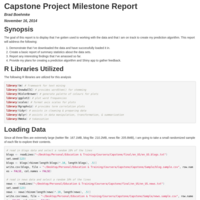
Capstone Project Milestone Report
This report provides an update on the text mining and prediction project for the Data Science Specialization capstone
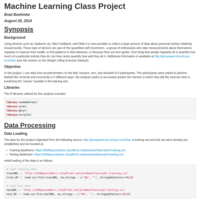
Practical Machine Learning Project
This project fulfills a requirement in the Practical Machine Learning course offered by Johns Hopkins for their Data Science Certification via Coursera. In this project, I use data from accelerometers on the belt, forearm, arm, and dumbell of 6 participants and apply a Random Forest modeling technique to accurately predict the manner in which they did the exercise.


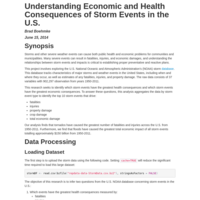
Reproducible Research/Peer Assessment 2
This project involves exploring the U.S. National Oceanic and Atmospheric Administration’s (NOAA) storm database. This database tracks characteristics of major storms and weather events in the United States, including when and where they occur, as well as estimates of any fatalities, injuries, and property damage. The raw data consists of 37 variables with 902,297 observation from years 1950-2011.
This research identifies which storm events have the greatest health consequences and which storm events have the greatest economic consequences at the aggregate level.