
coolfox0407
Hariharan D
Recently Published

NextGen NLP - Presentation
Future is power of accurate prediction!
NextGen NLP is state-of-art OneTouch app, which gives power of word prediction.
- Improves sentence completion by predicting successive words
- Improves spelling accuracy
- Improves speed of typing
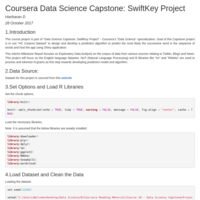
Coursera Data Science Capstone: Project Milestone Report
This course project is part of "Data Science Capstone: SwiftKey Project" - Coursera's "Data Science" specialization. Goal of this Capstone project is to use "HC Corpora Dataset" to design and develop a prediction algorithm to predict the most likely the successive word in the sequence of words and host the app using Shiny application.
This interim Milestone Report focuses on Exploratory Data Analysis on the corpus of data from various sources relating to Twitter, Blogs and News. This project will focus on the English language datasets. NLP (Natural Language Processing) and R libraries like "tm" and "RWeka" are used to process and tokenize N-grams as first step towards developing prediction model and algorithm.
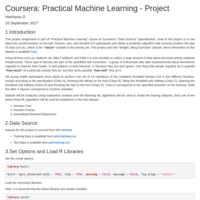
Practical Machine Learning - Predicting activity from personal activity tracker
This project assignment is part of “Practical Machine Learning” course at Coursera’s “Data Science” specialization. Goal of this project is to use data from accelerometers on the belt, forearm, arm, and dumbell of 6 participants and obtain a prediction algorithm that correctly predicts the type of class (A to E), which is the “classe” variable in the training set. This project uses the “Weight Lifting Exercises” dataset.
Using devices such as Jawbone Up, Nike FuelBand, and Fitbit it is now possible to collect a large amount of data about personal activity relatively inexpensively. These type of devices are part of the quantified self movement - a group of enthusiasts who take measurements about themselves regularly to improve their health, to find patterns in their behavior, or because they are tech geeks. One thing that people regularly do is quantify “how much” of a particular activity they do, but they rarely quantify “how well” they do it.
Six young health participants were asked to perform one set of 10 repetitions of the Unilateral Dumbbell Biceps Curl in five different fashions: exactly according to the specification (Class A), throwing the elbows to the front (Class B), lifting the dumbbell only halfway (Class C), lowering the dumbbell only halfway (Class D) and throwing the hips to the front (Class E). Class A corresponds to the specified execution of the exercise, while the other 4 classes correspond to common mistakes.
Dataset will be analyzed using exploratory analysis and the following ML algorithms will be used to model the training datasets. Best one of the below three ML algorithms will be used for predictions in the test dataset.
1. Decision Tree
2. Random Forests
3. Generalized Boosted Regression
myApp (Shiny)
"My Shiny" app is developed using RStudio - Shiny. This is an reactive app that takes input from user, processes the data and plots it to the output window. This app uses the "Motor Trend Car Road Test (mtcars) - USA, 1974" dataset ("mtcars").
All the tabs are independent of each other. The tab named "Plotly" takes the input from user through drop down box and radio button. User is required to select the "No. of cylinders" of the car and "No. of gears" of the car. Selected input is used to filter the original dataset for these values and plots the same in a scatterplot. The resulting plot depicts the impact of the "Car Weight" on "Miles Per Gallon (MPG)".
The tab named "Summary" summarizes the "MTCARS" dataset. The tab named "Leaflet" displays co-ordinates of my favourite dream vacation in Iceland - Aurora Borealis.
- See "ui.R" tab for details on UI logic of the Shiny web app.
- See "server.R" tab for details on Server logic of the Shiny web app.
Developing Data Products - R Markdown and Plotly
The data used in this R Markdown Presentation is from "mtcars" dataset (Motor Trend Car Road Test - USA, 1974). "Plotly" package is used to visualize the dataset using the function "plot_ly". Interactive Scatter plot displays MPG (Miles Per Gallon) vs WT (weight). CYL (Cylinders) are represented in difference colors while HP (Horse Power) is represented by size of the circle.
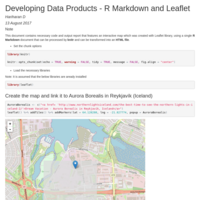
Coursera - Developing Data Products - R Markdown and Leaflet
Dream Vacation - Aurora Borealis in Reykjavík, Iceland
This document contains necessary code and output report that features an interactive map which was created with Leaflet library, using a single **R Markdown** document that can be processed by **knitr** and can be transformed into an **HTML file**.
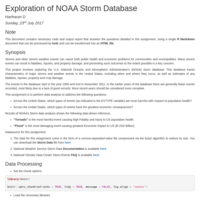
Exploration of NOAA Storm Database
Storms and other severe weather events can cause both public health and economic problems for communities and municipalities. Many severe events can result in fatalities, injuries, and property damage, and preventing such outcomes to the extent possible is a key concern.
This project involves exploring the U.S. National Oceanic and Atmospheric Administration’s (NOAA) storm database. This database tracks characteristics of major storms and weather events in the United States, including when and where they occur, as well as estimates of any fatalities, injuries, property and crop damage.
Activity Monitoring Data Analysis
This document is part of Coursera's assignment on Reproducible Research. Contains data analysis of sample data collected from personal activity monitoring devices.