
daranzolin
David Ranzolin
Recently Published
Add Range Label to Bar Plot
For: https://stackoverflow.com/questions/58311018/how-to-show-a-range-of-scale-values-when-plotting-means-on-bar-chart-in-r/58312167?noredirect=1#comment102986835_58312167
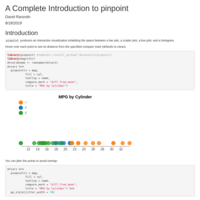
pinpoint: A Comprehensive Introduction
Introduction to the pinpoint packaage
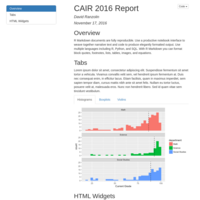
CAIR2016 Demo
R Markdown and knitr demo for CAIR 2016 Presentation
rcicero vignette
Vignette for rcicero package
mutateifelse
Brief tutorial creating new variables with mutate() and ifelse()