
djhocking
Daniel J. Hocking
Recently Published
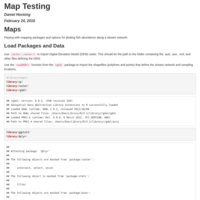
Stream_Fish_Map_Testing
This is just some experimenting with using raster and shapefiles to plot stream fish abundance in R. I use both base plot and ggplot2 to accomplish this and gridExtra to compare multiple plots.
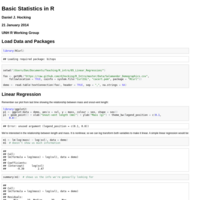
Basic Statistics in R
Very basic introduction to linear regression and ANOVA in R. Taught as a tutorial for the NH UseRs working group: http://www.nhusers.com