
ermoore
Evan Moore
Recently Published
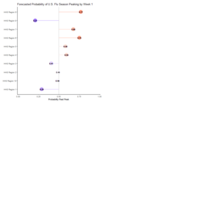
Visualizing Influenza Forecast Results
Compilation of work done for the Reich Lab during the Spring 2018 semester.

Introduction to R
Introductory R workshop covering R basics, data manipulation with dplyr and tidyr, visualization with ggplot2, and simple linear regression created for participants of Five College DataFest 2018.

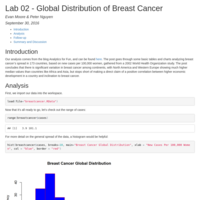
Analyzing Global Breast Cancer Distribution Rates
Lab 2 for PUBHLTH 490ST - Reich