
fmonzon
Franklin Monzon
Recently Published
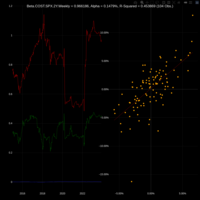
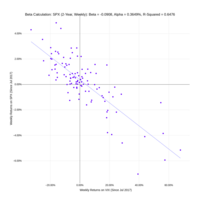
Beta (COST, SPX)
This time series describes the 2-year, weekly, beta of Costco Wholesale Corporation (NASDAQ: COST) with respect to the S&P 500 (^SPX). Data were sourced from Yahoo Finance, using R.
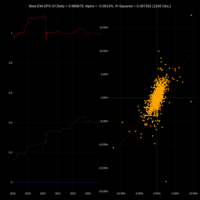
Beta (EW, SPX)
This time series describes the 5-year, daily, beta of Edwards Lifesciences Corporation (NYSE:EW) with respect to the S&P 500 (^SPX). Data were sourced from Yahoo Finance, using R.
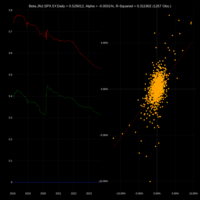
Beta (JNJ, SPX)
This time series describes the 5-year, daily, beta of Johnson & Johnson (NYSE: JNJ) with respect to the S&P 500 (^SPX). Data were sourced from Yahoo Finance, using R.
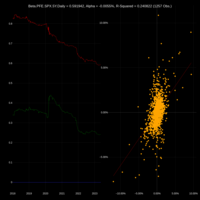
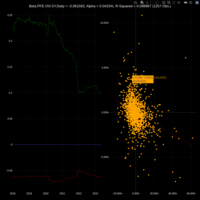
Beta (PFE, SPX)
This time series describes the 5-year, daily, beta of Pfizer Inc. (NYSE: PFE) with respect to the S&P 500 (^SPX). Data were sourced from Yahoo Finance, using R.
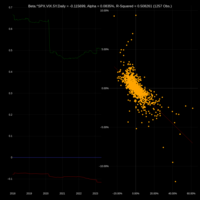
Beta (PFE, VIX)
This time series describes the 5-year, daily, beta of Pfizer Inc. (NYSE: PFE) with respect to the CBOE Volatility Index (^VIX). Data were sourced from Yahoo Finance, using R.
Beta (SPX, VIX)
This time series describes the 5-year, daily, beta of the S&P 500 (^SPX) with respect to the CBOE Volatility Index (^VIX). Data were sourced from Yahoo Finance, using R.
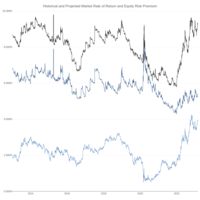
Market Rate of Return and Equity Risk Premium
Equity risk premium, as plotted in Plotly. Earnings forecasts sourced from Damodaran's work on the ERP.
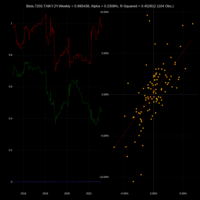
Beta.7203T.NKY.2Y.Weekly
This is the 2-year, weekly beta of Toyota Motor Corporation (TSE: 7203), with respect to the Nikkei Stock Average (Nikkei 225, NKY).
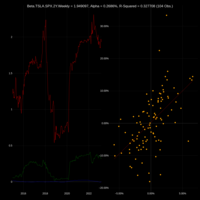
Beta.TSLA.SPX.2Y.Weekly
This is the 2-year, weekly beta of Tesla, Inc. (NASDAQ: TSLA), with respect to the S&P 500 (SPX).
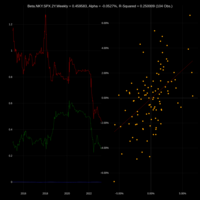
Beta.NKY.SPX.2Y.Weekly
This is the 2-year, weekly beta of Nikkei Stock Average (Nikkei 225, NKY), with respect to the S&P 500 (SPX).
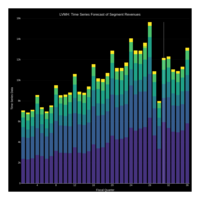
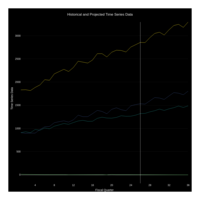
Time Series Forecast: Segment Revenue (XPAR: MC)
Time series forecast of the segment revenues, of LVMH Moët Hennessy Louis Vuitton SE (XPAR: MC). Forecast as the average of additive and multiplicative time series forecasts, using data from 1Q2013 to 3Q2020.
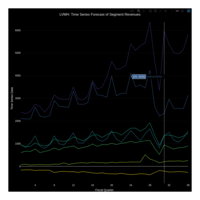
Time Series Forecast: Segment Revenue (XPAR: MC)
Time series forecast of the segment revenues, of LVMH Moët Hennessy Louis Vuitton SE (XPAR: MC). Forecast as the average of additive and multiplicative time series forecasts, using data from 1Q2013 to 3Q2020.

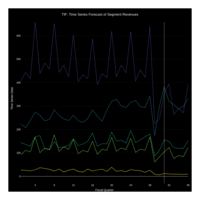
Time Series Forecast: Segment Revenue (NYSE: TIF)
Time series forecast of the segment revenues, of Tiffany & Co. (NYSE: TIF). Forecast as the maximum of additive and multiplicative time series forecasts, using data from 1Q2013 to 3Q2020.
Time Series Forecast: Segment Revenue (NYSE: TIF)
Time series forecast of the segment revenues, of Tiffany & Co. (NYSE: TIF). Forecast as the maximum of additive and multiplicative time series forecasts, using data from 1Q2013 to 3Q2020.
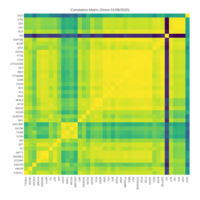
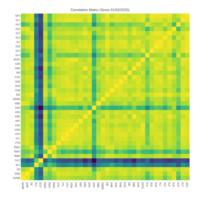
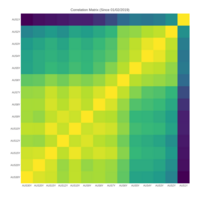
Correlation Matrix: GILD, ETFs
Correlation matrix of returns series on GILD compared to common equities indices, and ETFs, since the start of 2020.
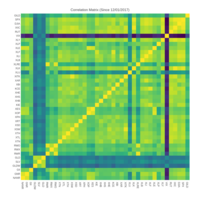
Correlation Matrix: GILD
Correlation matrix of returns series on GILD compared to various equities indices, since the start of 2020.
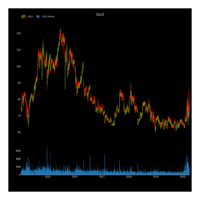
GILD
Gilead Sciences, Inc. (NASDAQ: GILD), since 2014-01-01
Industry and Asset Correlation to the S&P
Correlation matrix of returns series compared to the S&P 500, since the start of 2020.
Sector ETFs vs S&P
SPDR Sector ETFs, including S&P 500 (SPX), 2020 performance.
Industry (Modified Equal Weighted) ETFs (Part 1)
SPDR Industry (Modified Equal Weighted) ETFs, 2020 performance.
Industry (Modified Equal Weighted) ETFs (Part 2)
SPDR Industry (Modified Equal Weighted) ETFs, 2020 performance.
Commodity/Real Assets ETFs
SPDR Commodity/Real Assets ETFs, 2020 performance.
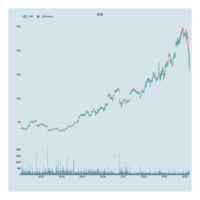
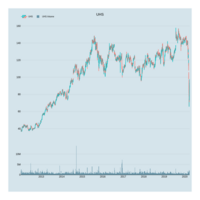
EW
Edwards Lifesciences Corporation (NYSE: EW), as plotted in Plotly. Data sourced from Investing.com, using selenium in Python.
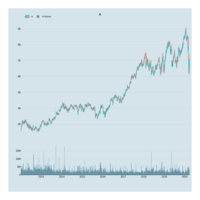
A
Agilent Technologies, Inc. (NYSE: A), as plotted in Plotly. Data sourced from Investing.com, using selenium in Python.
REGN
Regeneron Pharmaceuticals, Inc. (NASDAQ: REGN), as plotted in Plotly. Data sourced from Investing.com, using selenium in Python.
UHS
Universal Health Services, Inc. (NYSE: UHS), as plotted in Plotly. Data sourced from Investing.com, using selenium in Python.
MRK
Merck & Co., Inc. (NYSE: MRK), as plotted in Plotly. Data sourced from Investing.com, using selenium in Python.

VAR
Varian Medical Systems, Inc. (NYSE: VAR), as plotted in Plotly. Data sourced from Investing.com, using selenium in Python.
XRAY
Dentsply Sirona Inc. (NASDAQ: XRAY), as plotted in Plotly. Data sourced from Investing.com, using selenium in Python.
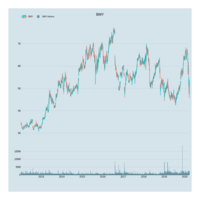
BMY
Bristol-Myers Squibb Company (NYSE: BMY), as plotted in Plotly. Data sourced from Investing.com, using selenium in Python.
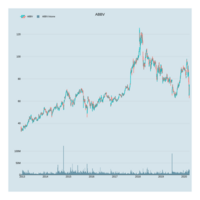
ABBV
AbbVie Inc. (NYSE: ABBV), as plotted in Plotly. Data sourced from Investing.com, using selenium in Python.
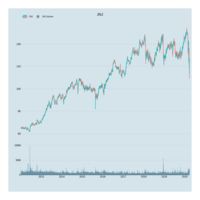
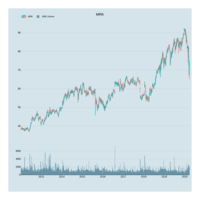
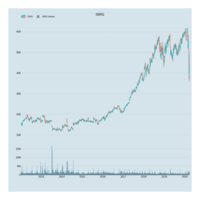
JNJ
Johnson & Johnson (NYSE: JNJ), as plotted in Plotly. Data sourced from Investing.com, using selenium in Python.
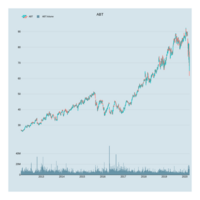
ABT
Abbott Laboratories (NYSE: ABT), as plotted in Plotly. Data sourced from Investing.com, using selenium in Python.
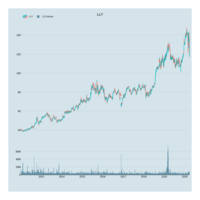
LLY
Eli Lilly and Company (NYSE: LLY), as plotted in Plotly. Data sourced from Investing.com, using selenium in Python.
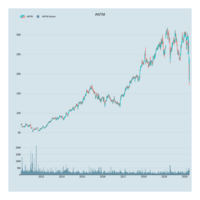
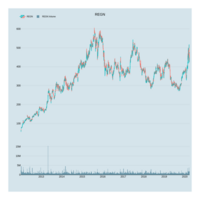
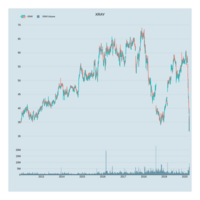
ANTM
Anthem, Inc. (NYSE: ANTM), as plotted in Plotly. Data sourced from Investing.com, using selenium in Python.
ISRG
Intuitive Surgical, Inc. (NASDAQ: ISRG), as plotted in Plotly. Data sourced from Investing.com, using selenium in Python.
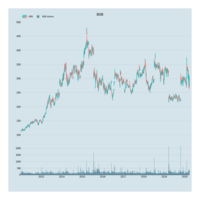
BIIB
Biogen Inc. (NASDAQ: BIIB), as plotted in Plotly. Data sourced from Investing.com, using selenium in Python.
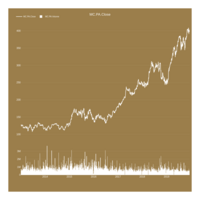
LVMH
LVMH MOËT HENNESSY LOUIS VUITTON SA (XPAR: MC), as plotted in Plotly. Data sourced from Investing.com, using selenium in Python.
TIF
Tiffany & Co. (NYSE: TIF), as plotted in Plotly. Data sourced from Investing.com, using selenium in Python.
Time Series Forecast: Segment Revenue (NYSE: UHS)
Time series forecast of the segment revenue, and total revenues, of Universal Health Services, Inc. (NYSE: UHS). Multiplicative time series forecast, using data from 1Q2013 to 2Q2019.
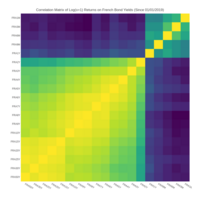
Correlation Matrix of Log(x+1) Returns on French Bonds
In the French yield curve, instances of negative yields have produced negative results in the ln(x2/x1) calculation of log returns. As a possible solution, we've used the ln(x+1) procedure to normalize for those instances.
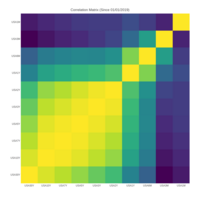
Correlation Matrix on US Bonds
Year to Date Correlation Matrix on US Bond Yields (YTM)
Correlation Matrix on Australian Bonds
Year to Date Correlation Matrix on Australian Bond Yields (YTM)
Beta.VIX.2Y.w.SPX
2-year weekly beta of the S&P 500, with respect to the VIX.
Beta.VIX.2Y.w.DJIA
2-year weekly beta of the Dow Jones, with respect to the VIX.
Beta.VIX.2Y.w.RUT
2-year weekly beta of the Russell 2000, with respect to the VIX.
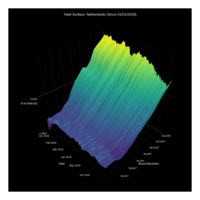
Year to Date Yield Surface on Dutch Bonds
Year to date surface plot of the time series of the Dutch yield curve.
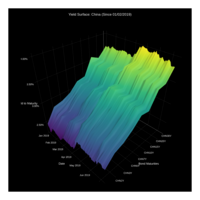
Year to Date Yield Surface on Chinese Bonds
Year to date surface plot of the time series of the Chinese yield curve.
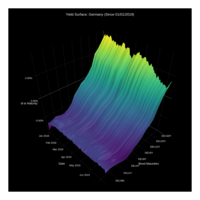
Year to Date Yield Surface on German Bonds
Year to date surface plot of the time series of the German yield curve.
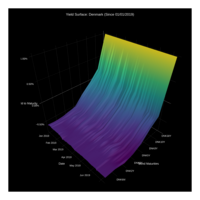
Year to Date Yield Surface on Danish Bonds
Year to date surface plot of the time series of the Danish yield curve.
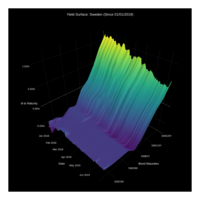
Year to Date Yield Surface on Swedish Bonds
Year to date surface plot of the time series of the Swedish yield curve.
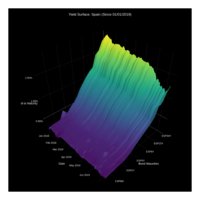
Year to Date Yield Surface on Spanish Bonds
Year to date surface plot of the time series of the Spanish yield curve.
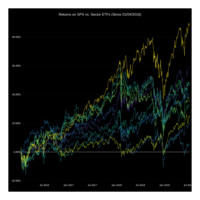
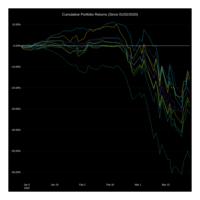
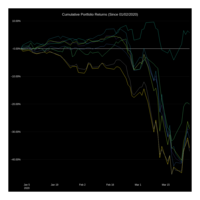
Returns on SPX vs. Sector ETFs
Cumulative returns on selected sector ETFs vs. the performance of the S&P 500 (SPX).
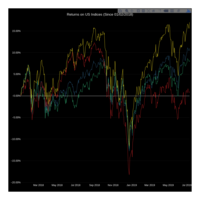
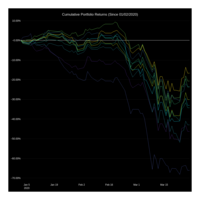
Returns on US Indices
Recent cumulative returns on US equities indices.
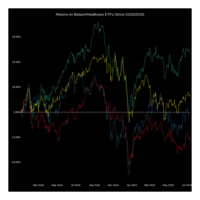
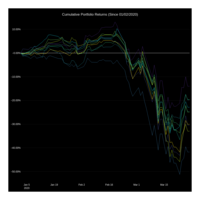
Returns on Biotech/Healthcare ETFs
Recent cumulative returns on selected Biotech/Healthcare ETFs.
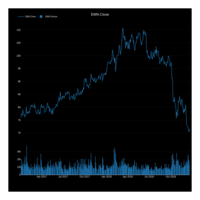
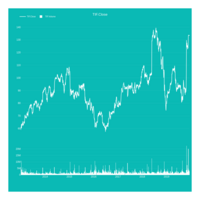
EMN (01/03/2017 - 12/19/2018)
Eastman Chemical Company (NYSE: EMN), as plotted using Plotly.
Data sourced from Yahoo Finance, using R.
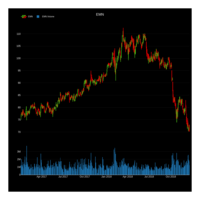
EMN (01/03/2017 - 12/19/2018)
Eastman Chemical Company (NYSE: EMN), as plotted using Plotly.
Data sourced from Yahoo Finance, using R.
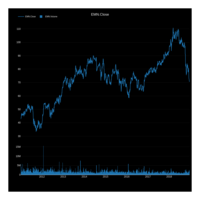
EMN (01/03/2011 - 12/19/2018)
Eastman Chemical Company (NYSE: EMN), as plotted using Plotly.
Data sourced from Yahoo Finance, using R.
EMN (01/03/2011 - 12/19/2018)
Eastman Chemical Company (NYSE: EMN), as plotted using Plotly.
Data sourced from Yahoo Finance, using R.
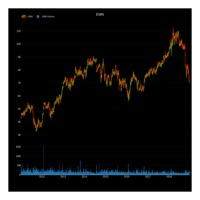
CVS (12/02/2013 - 11/30/2018)
CVS Health Corporation (NYSE: CVS), as plotted using Plotly.
Data sourced from Yahoo Finance, using R.

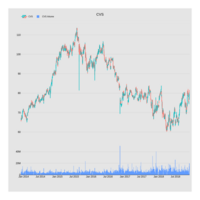
AET (12/02/2013 - 11/28/2018)
Aetna Inc. (NYSE: AET), as plotted using Plotly.
Data sourced from Yahoo Finance, using R.
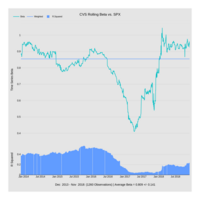
Beta.CVS.SPX
This time series describes the 1-year, daily, beta of CVS Health Corporation (NYSE: CVS) with respect to the S&P 500 (^SPX). Data were sourced from Yahoo Finance, using R.
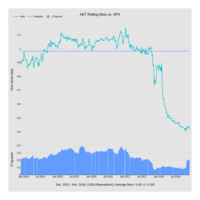
Beta.AET.SPX
This time series describes the 1-year, daily, beta of Aetna Inc. (NYSE: AET) with respect to the S&P 500 (^SPX). Data were sourced from Yahoo Finance, using R.
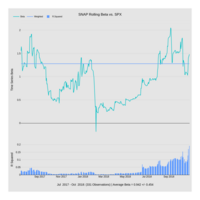
Beta.SPX.90-day.d.SNAP
This is the 90-day rolling beta of SNAP with respect to the S&P 500. A further feature considered was the R-squared weighted average of the time series.
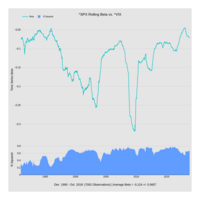
Beta.VIX.SPX
This time series describes the 1-year, daily, beta of the S&P 500 (^SPX) with respect to the CBOE Volatility Index (^VIX). Data were sourced from Yahoo Finance, using R.