
jcweaver5
James C Weaver
Recently Published
Lumberjack App for Timberland Management
The Lumberjack App calculates the "Volume" of a tree in cubic feet from the tree's Girth in inches and Height in feet.
- App is deployed in real-time to the mobile device
- App uses a predictive model based on data from black cherry trees (the "trees" dataset in the R datasets package)
- Predictive model based on a linear regression that models a tree as a cylinder
- The interactive App can be viewed on the shinyapps.io server at the url https://jcweaver5.shinyapps.io/lumberjack-app/
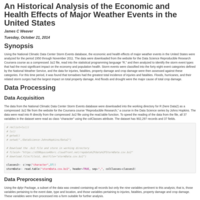
An Historical Analysis of the Economic and Health Effects of Major Weather Events in the United States
Using the National Climatic Data Center Storm Events database, the economic and health effects of major weather events in the United States were analyzed for the period 1950 through November 2011. The data were downloaded from the website for the Data Science Reproducible Research Coursera course as a compressed .bz2 file, read into the statistical programming language “R,” and then analyzed to identify the storm event types that had the most significant impact on the economy and population health. Storm events were classified into the forty eight event categories defined by the National Weather Service, and the data for injuries, fatalities, property damage and crop damage were then assessed against these categories. For this time period, it was found that tornadoes had the greatest total incidence of injuries and fatalities. Floods, hurricanes, and their related storm surges had the largest impact on total property damage. And floods and drought were the major cause of total crop damage.

PA1_template
Johns Hopkins Data Science Coursera course- Reproducible Research
Peer Assessment 1- Analysis of Activity Data