
k_sanju0
Sanjive
Recently Published
Week 6, Banks Problem 5 Discussion
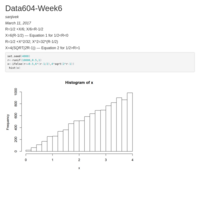
Generation of CDF
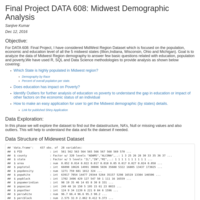
DATA 608: Final Project
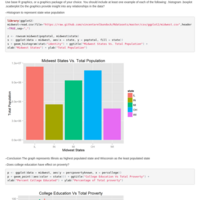
Midwest Region demographic analysis
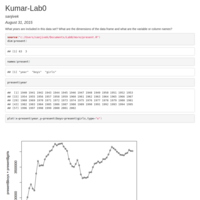
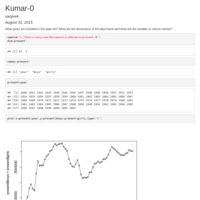
Kumar-0
Lab0 for week 1
R Assignment Week4
Use base R graphics, or a graphics package of your choice. You should include at least one example of each of the following:
.histogram
.boxplot
.scatterplot
Do the graphics provide insight into any relationships in the data?
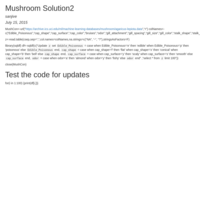
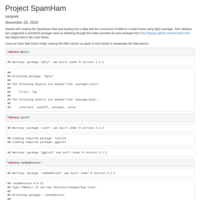
Mushroom Data Transformation Solution 1
This is first solution for Mushroom Data Transformation