kalendaniel
Kalen Daniel
Recently Published
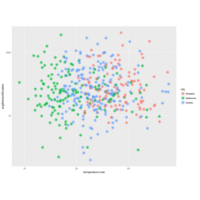
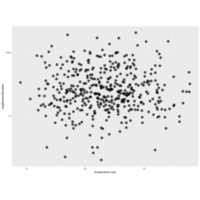
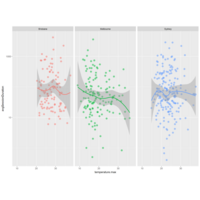
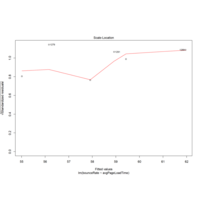
Avg time in session and weather correlation city
Using web scraper to pull weather table data and compare/correlate using a "loess" with the visit/session duration
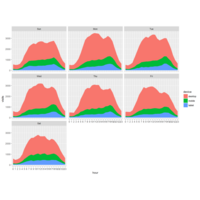
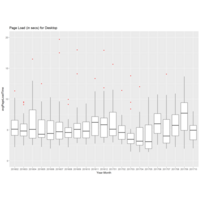
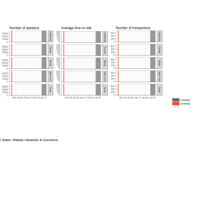
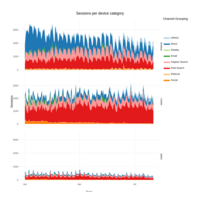
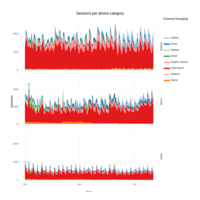
Visits During Certain Days of the Week
Day of the week, aggregation of hour and segmentation of device.
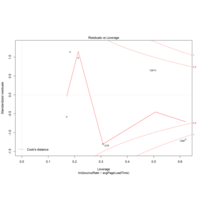
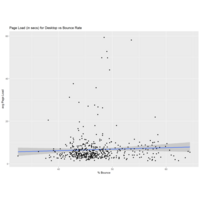
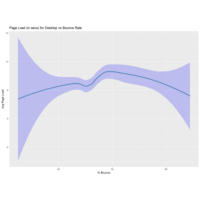
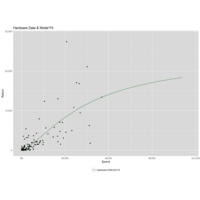
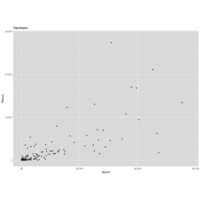
Page Load Time vs. Bounce Rate
At first glance- it looks like just above 5 seconds the bounce rate starts to shift. It is showing smoothing in this diagram to represent the correlation and bounds for the page load time in relation to the bounce rate increasing probability.
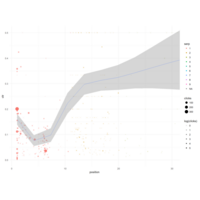
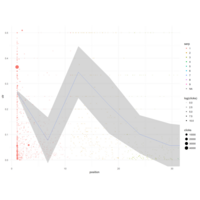
Click Curve VD CTR
We now use the data to create a click curve table, with estimates on the CTR for each position, and the confidence in those results.
The diagram below uses a weighted loess within ggplot2 which is good to show trend but not for making predictions.
CTR Rate Position Index Oppurtunity
These CTR rates are then used to predict how much more traffic/revenue etc. a keyword could get if they moved up to position 1.
CTR from Google Search Results
We now use the data to create a click curve table, with estimates on the CTR for each position, and the confidence in those results. The diagram above uses a weighted loess within ggplot2 which is good to show trend but not for making predictions.
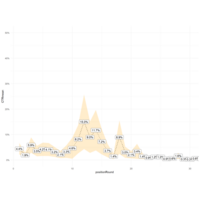
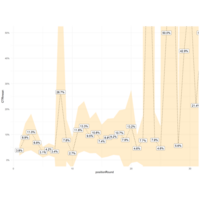
SERP Predicted Potential on Keyword Placement
These CTR rates are then used to predict how much more traffic/revenue etc. a keyword could get if they moved up to position 1. This chart is basically showing how much more oppurtunity for traffic and revenue we would get if lets say - position 30 keyword on end of page 3 moved up to page 1 in the top 10 or even page 2 in the top 10-20.
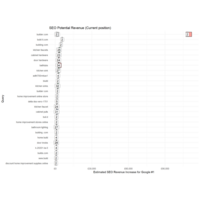
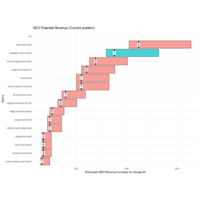
SEO Potential Keywords for Revenue
All that remains to to present the data: limiting the keywords to the top 30 lets you present like below.
The bars show the range of the estimate, as you can see its quite wide but lets you be more realistic in your expectations.
The number in the middle of the bar is the current position, with the revenue at the x axis and keyword on the y.
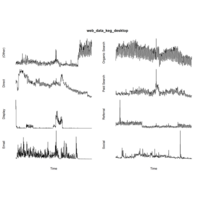
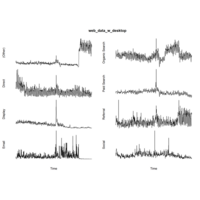
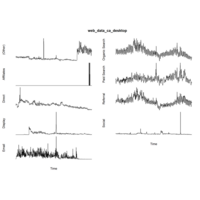

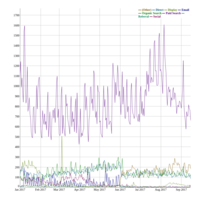
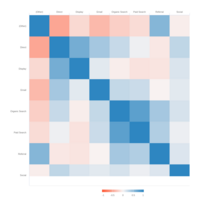
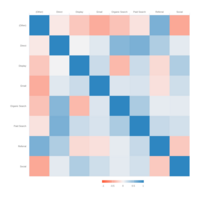
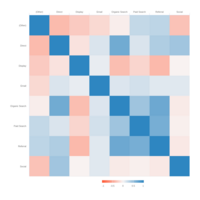
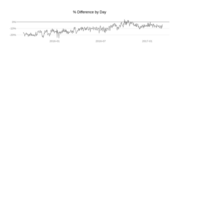
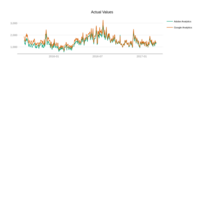
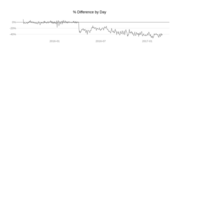
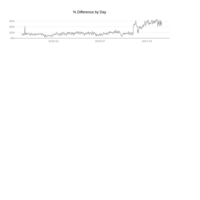
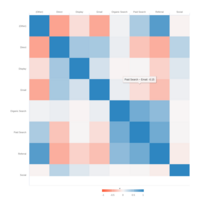
Correlation Report LDI April 2016 to Sept 1 2017
Correlations
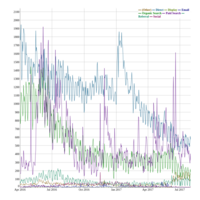
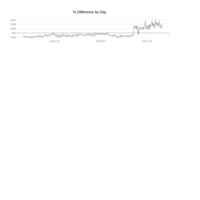
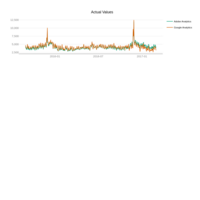
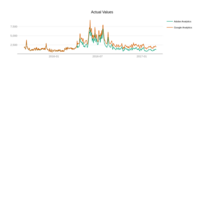
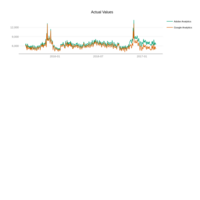
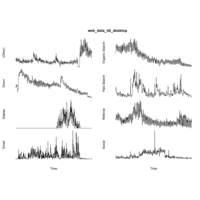
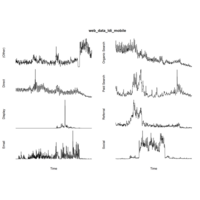
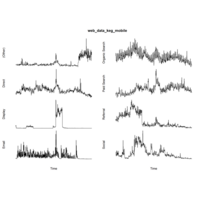
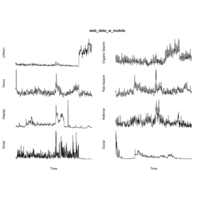
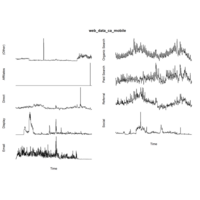
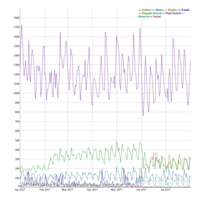
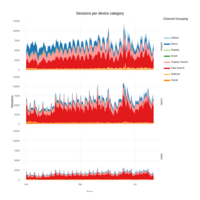
LDI Channels Mobile 2017
Mobile Trend
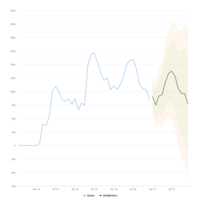
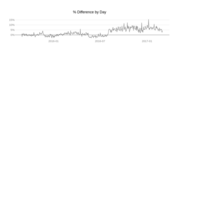
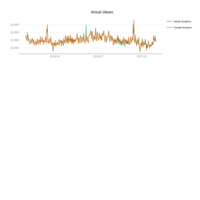
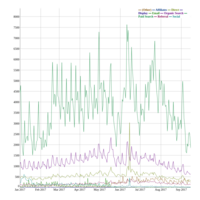
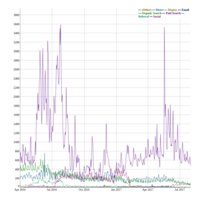
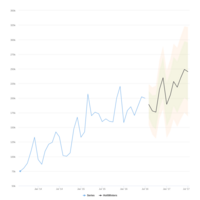
Forecast Ice EOY 2016 to Present
What would have happened if we rewind the time back to EOY 2016. What would the trend have looked like for IceMaker?
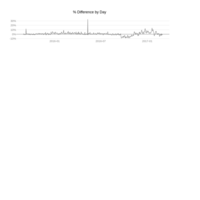
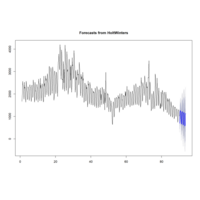
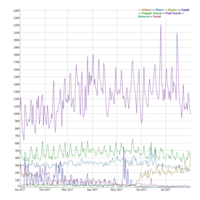
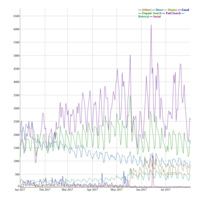
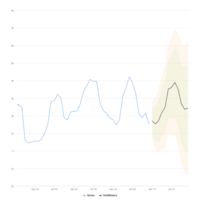
Kegerator Organic Trended
With Forecast Using Holt-Winters
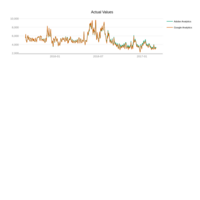
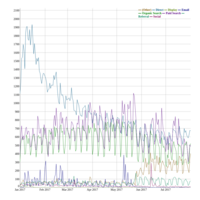
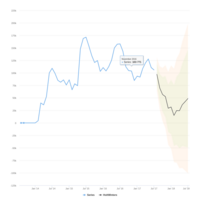
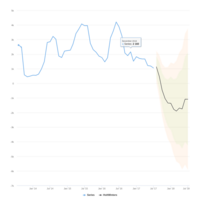
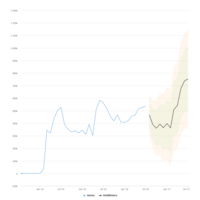
Kegerator Forecast
Forecast of Kegerator. Drops validated from the pre-transition due to the traffic growth stalling around Summer of last year
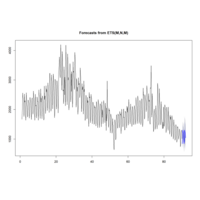
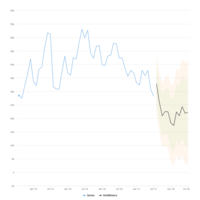
Forecast for CA
Forecast For CA Using Hold Winters