Recently Published
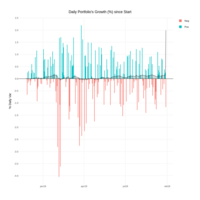
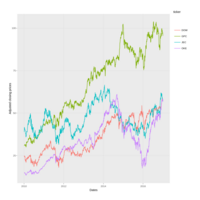
Portfolio growth chart
HTML Java
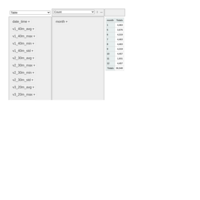
Pivottable winddata
HTML Java Pivottable

Text analysis - word count Prince
HTML java

Text analysis - Word cloud Prince
HTML java wordcloud
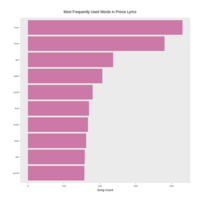
Text analysis in music - Prince
HTML java chart
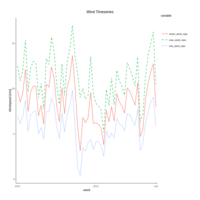
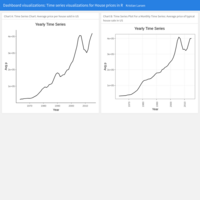
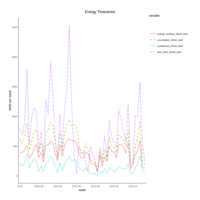
Wind timeseries
HTML
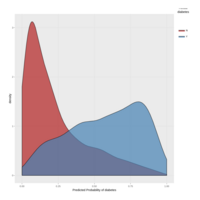
AI predict diabetes
AI predict diabetes HTML graph
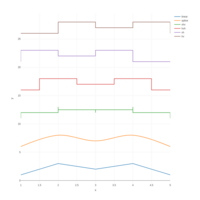
Line Interpolation
Line Interpolations HTML
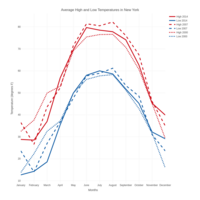
Temperature graph PlotLy
Temperature graph HTML
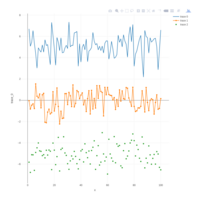
HTML Graphs with PlotLY
HTML Graphs with PlotLY
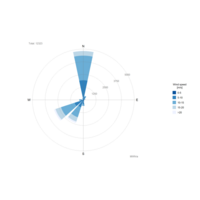
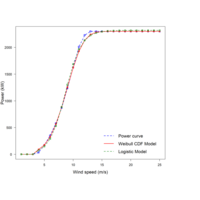
Annual energy production
Annual energy production for Wind Turbines
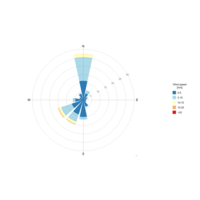
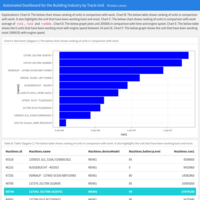
Met mast frequency
Met Mast Object for Wind Turbines
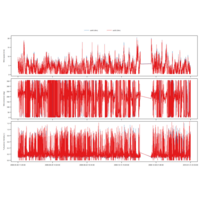
Met Mast Object
Met Mast Object for Wind Turbines
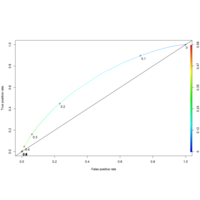
Credit Modelling ROC curve
Credit Modelling ROC curve
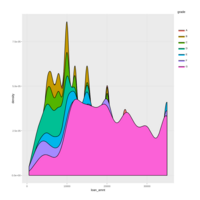
Density plot on loans
Density plot on loan based on grade type HTML
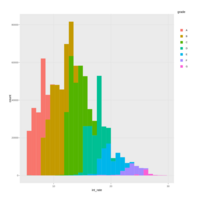
Histogram on interest rate
Histogram on interest rate based on grade HTML
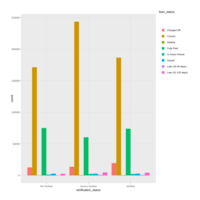
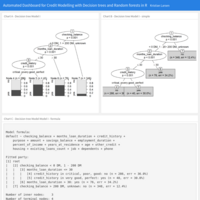
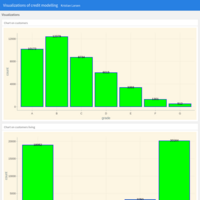
Credit Risk Modelling - loans
Credit Risk Modelling - loans HTML
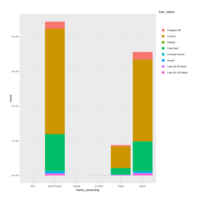
Credit Risk Modelling - loans
Credit Risk Modelling - loans HTML
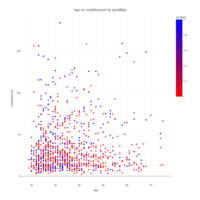
Credit Modelling by age
Credit Modelling by age HTML
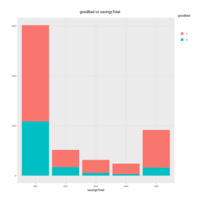
Credit modelling
Credit modelling: Good/bad HTML
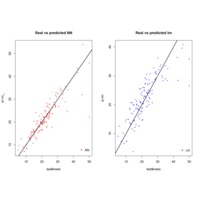
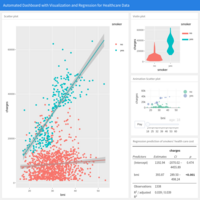
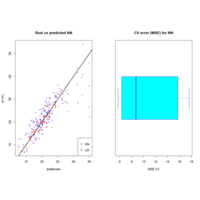
Neural Networks & OLS
Neural Networks & OLS Predictive Graph
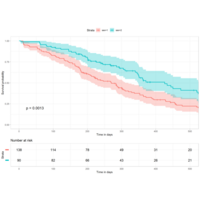
Survival Analysis
Survival Analysis: Kaplan-Meier
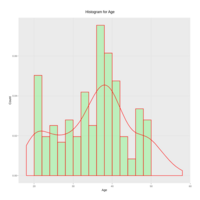
Histogram with Trendline
Histogram with Trendline in HTML
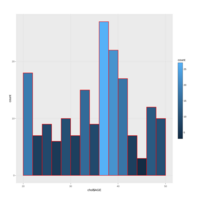
Histogram with count
Histogram with count in HTML
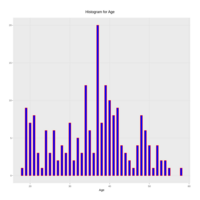
Histogram
Histogram in HTML

Statistics: OLS & Logistic
Statistics: OLS & Logistic HTML

Annova Table
Annova HTML Table
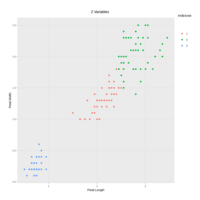
Scatterplot
HTML Scatterplot
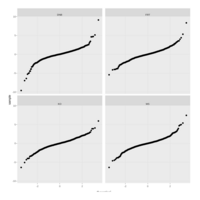
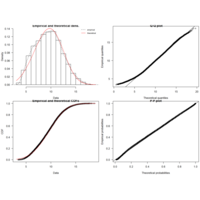
QQPlot Panels
QQPlot Panels in HTML
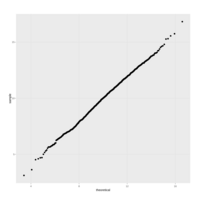
QQPlot
QQPlot in HTML
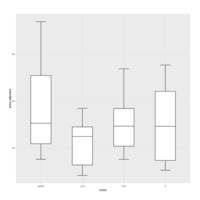
Boxplot Figures
Boxplot Figures in HTML
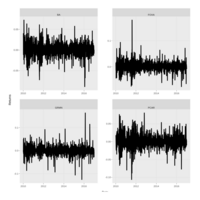
Panel Graph Zoom
Panel Graph HTML
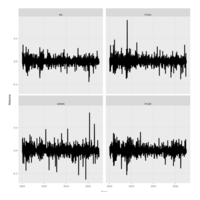
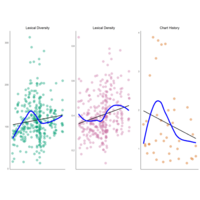
Panel Graph
Panel Graph HTML
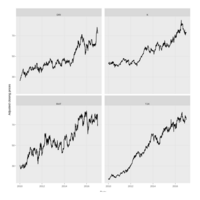
Panel Graph
Panel Graph HTML
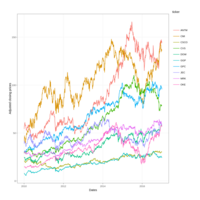
Multiple graph
Multiple HTML graph
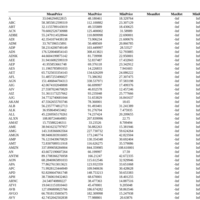
Spy500
Spy500 HTML

Balance Sheet
Balance HTML

Simple Balance
Simple Balance HTML
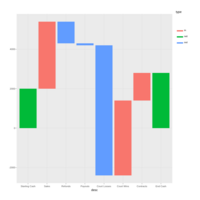
Waterfall graph
Aktiver og passiver
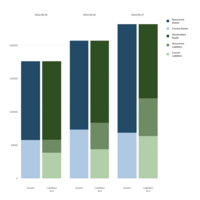
Stacked Bar Chart
Assets and liabilities HTML
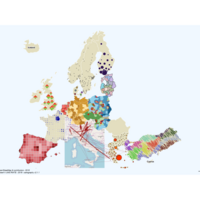
Cartography
For Geomapping
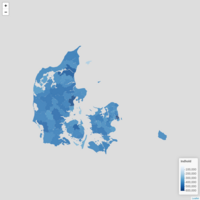
Population per municipality
Population per municipality in Denmark HTML
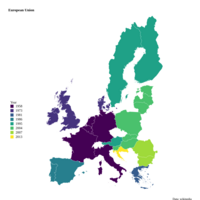
European Union
D3 Interactive java HTML
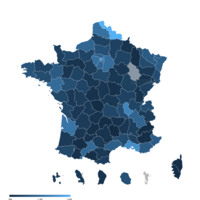
France - Departments by population
D3 Interactive java HTML
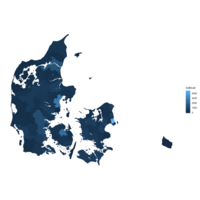
Burglary per municipality
Burglary per municipality in Denmark
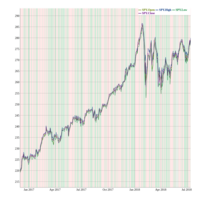
SPY500
SPY500 value from 2016-12-01 until 2018-15-07
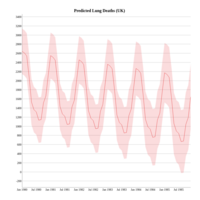
Predicted Lung Deaths
Illustrated shaded bars, specifying a plot title
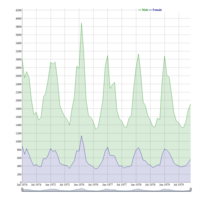
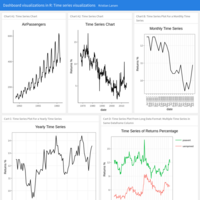
Lung Deaths
dygraph created from a multiple time series object
Pivot Bar Chart
Pivot Bar Chart HTML

