
lakenp
Paul van der Laken
Recently Published
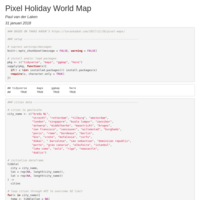
Pixel World Map of Holiday Destinations
For more info: https://paulvanderlaken.com/2018/01/31/pixel-maps-in-r/
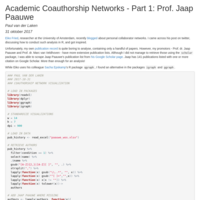
Academic Coauthorship Networks - Part 1: Prof. Jaap Paauwe
Eiko Fried, researcher at the University of Amsterdam, recently blogged about personal collaborator networks. I came across his post on twitter, discussing how to conduct such analysis in R, and got inspired. This is my take on the project
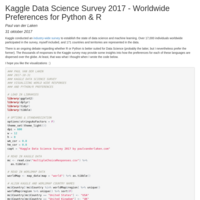
Kaggle Data Science Survey 2017 - Language Preferences Worldmap
Based on the responses to the Kaggle Data Science Survey 2017, I visualized to what extent data scientists prefer to work in either R, Python or both. I mapped these data on a worldmap to spot country level differences.
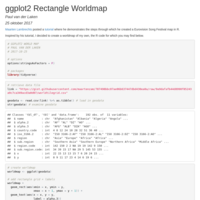
ggplot2: Rectangle Worldmap
Inspired by Maarten Lambrechts' blog post (http://www.maartenlambrechts.com/2017/10/22/tutorial-a-worldtilegrid-with-ggplot2.html) I decided to make my own ggplot2 world map.
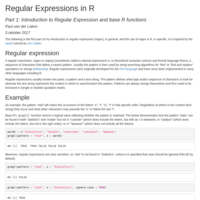
Regular Expression in R - Part 1: Base R Functions
In this first tutorial on regular expression in R, we introduce the concept of a regular expression and handle R's seven base functions (grep, grepl, regexpr, gregexpr, regexec, sub, and gsub).
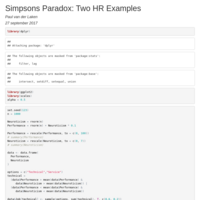
Simpsons Paradox: Two HR examples
Simpson (1951) demonstrated that a statistical relationship observed within a population—i.e., a group of individuals—could be reversed within all subgroups that make up that population. This phenomenon, where X seems to relate to Y in a certain way, but flips direction when the population is split for W, has since been referred to as Simpson's paradox. Others names, according to Wikipedia, include the Simpson-Yule effect, reversal paradox or amalgamation paradox.
This document simulates HR data that demonstrate two ways in which the paradox may occur in an organizational or HR setting
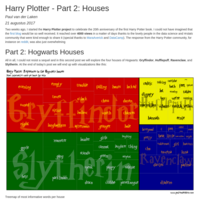
Harry Plotter: Part 2 - Hogwarts' Houses and their Stereotypes
In this second part of the Harry Plotter project, we use tf-idf and ratio statistics to examine which words are most informative / unique to each of the houses of Hogwarts. The data was retrieved using the harrypotter package and transformed using tidytext and the tidyverse. Visualizations were made with ggplot2 and treemapify, using a Harry Potter font.
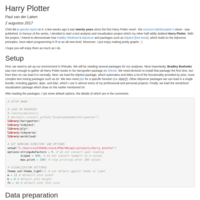
Harry Plotter
A celebration of twenty years of Harry Potter with R using the tidyverse and tidytext.