
lwaldron
Levi Waldron
Recently Published


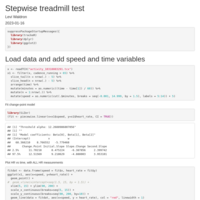
Stepwise treadmill test
Change-point model of stepwise treadmill test
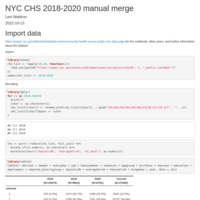
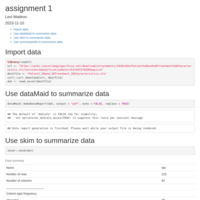
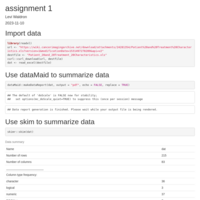
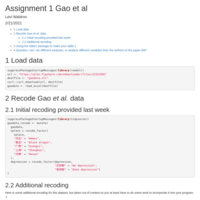
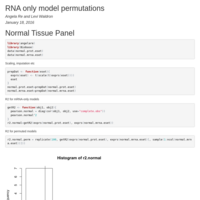
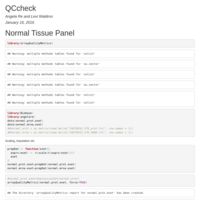
Manual merge of CHS 2018-2020
Note that this is a workaround for the harmonized weights that NYCDOHMH can provide.


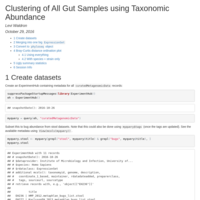
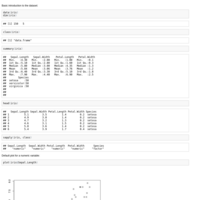
List all species present in CRC datasets
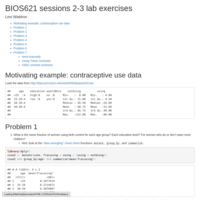
This analysis selects a subset of samples (all CRC-related in this example), sorts those those species in order of descending prevalence, then displays a table of prevalences and writes the prevalences to file.


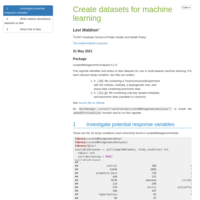
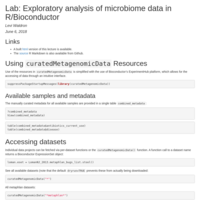
curatedMetagenomicData for Machine Learning
These datasets have case-control labels (study_condition) and two or more independent datasets. It produces two versions: a TreeSummarizedExperiment containing all sample metadata and a phylogenetic tree, and a csv file containing only taxonomic data and a few key metadata columns.

Applied Statistics for High-throughput Biology Day 4
## Day 4 outline
[Book](https://genomicsclass.github.io/book/) chapter 8:
- Distances in high dimensions
- Principal Components Analysis and Singular Value Decomposition
- Multidimensional Scaling
- Batch Effects (Chapter 10)

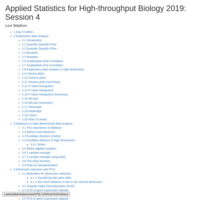
Applied Statistics for High-throughput Biology: Session 2
Session 2 outline
Hypothesis testing for categorical variables
Resampling methods
Exploratory data analysis
Applied Statistics for High-throughput Biology: Session 1
Day 1 outline
* Some essential R classes and related Bioconductor classes
* Random variables and distributions
* Hypothesis testing for one or two samples (t-test, Wilcoxon test, etc)
* Confidence intervals
* Introduction to dplyr
Book chapters 0 and 1

assignment 3 demo
code loading and ioslides demo

Applied Statistics for High-throughput Biology 2019, Day 4
- Distances in high dimensions
- Principal Components Analysis
- Multidimensional Scaling
- Batch Effects
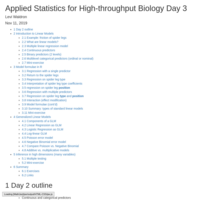
Applied Statistics for High-throughput Biology Day 3
* Multiple linear regression
+ Continuous and categorical predictors
+ Interactions
* Model formulae
* Generalized Linear Models
+ Linear, logistic, log-Linear links
+ Poisson, Negative Binomial error distributions
* Multiple Hypothesis Testing
Textbook sources:
* Chapter 5: Linear models
* Chapter 6: Inference for high-dimensional data
Applied Statistics for High-throughput Biology 2019, Day 2
- Hypothesis testing for categorical variables
- Fisher's Exact Test and Chi-square Test
- Resampling methods
+ Permutation Tests
+ Cross-validation
+ Bootstrap
- Exploratory data analysis
Applied Statistics for High-throughput Biology 2019, Day 1
## Day 1 outline
- Some essential R classes and related Bioconductor classes
- Introduction to `dplyr`
- Random variables and distributions
- Hypothesis testing for one or two samples (t-test, Wilcoxon test, etc)
- Confidence intervals
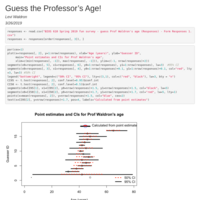
Guess the professor's age!
A survey of Prof Waldron's age to help think about confidence intervals.
UNIVR Applied Statistics for High-throughput Biology 2019: Day 4
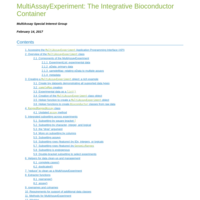
This workshop demonstrates data management and analyses of multiple assays associated with a single set of biological specimens, using the `MultiAssayExperiment` data class and methods.
UNIVR Applied Statistics for High-throughput Biology 2019: Day 2
* Multiple linear regression
+ Continuous and categorical predictors
+ Interactions
* Model formulae
* Generalized Linear Models
+ Linear, logistic, log-Linear links
+ Poisson, Negative Binomial error distributions
* Multiple Hypothesis Testing
Guess Professor Waldron's age
An example for improving intuition and interpretation of confidence intervals
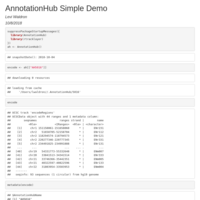
AnnotationHub Simple Demo
An encode track

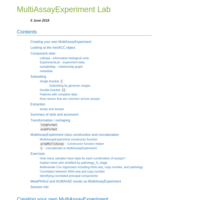
Workflow for multi-omics analysis with MultiAssayExperiment
This workshop demonstrates data management and analyses of multiple assays associated with a single set of biological specimens, using the `MultiAssayExperiment` data class and methods. It introduces the `RaggedExperiment` data class, which provides efficient and powerful operations for representation of copy number and mutation and variant data that are represented by different genomic ranges for each specimen.
EPIC 2018 - intro lab
curatedMetagenomicData, distances, PCA / PCoA
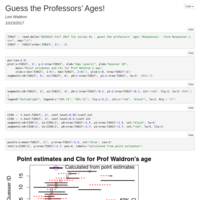
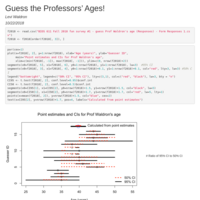
Guess the Professors' Ages
Results of a survey given in BIOS 611 in 2015 and 2017

Sub1
messy example analysis
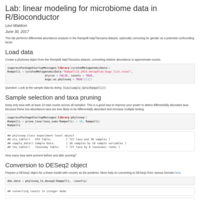

Lecture: linear modeling for microbiome data in R/Bioconductor
## Outline
* Multiple linear regression
+ Continuous and categorical predictors
+ Interactions
* Model formulae
* Design matrix
* Generalized Linear Models
+ Linear, logistic, log-Linear links
+ Poisson, Negative Binomial error distributions
+ Zero inflation
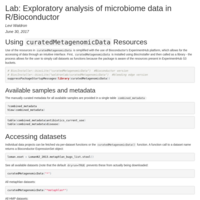
Lecture: Exploratory analysis of microbiome data in R/Bioconductor
## Outline
- Statistical properties of metagenomic data
- Distances for high dimensional data
- Principal Components and Principal Coordinates Analysis
- Alpha diversity
Applied Statistics for High-throughput Biology Day 2: distances, PCA, batch effects
Distances in high dimensions
Principal Components Analysis
Multidimensional Scaling
Batch Effects
Book chapter 7

Applied Statistics for High-throughput Biology Day 3: categorical data, exploratory data analysis
- Inference in high dimensions: multiple testing
- Hypothesis testing for categorical variables
- Fisher's Exact Test and Chi-square Test
- Exploratory data analysis

Applied Statistics for High-throughput Biology Day 2: linear models
Linear and Generalized Linear Models, multiple testing
Applied Statistics for High-Throughput Biology 2017, day 1
Introduction to random variables and to R
CSAMA 2017 - Resampling Methods
Resampling: cross-validation, bootstrap, and permutation tests
Resampling Methods
Iowa Institute of Human Genetics 2017 bioinformatics short course
Analysis of Microbiome Data
Iowa Institute of Human Genetics 2017 bioinformatics short course
Book club - distances
Data Analysis for the Life Sciences, Chapter 8 section 1
BIOS 621 session 5
Loglinear models part 2
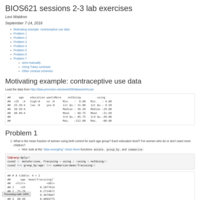
BIos621_session1_lab
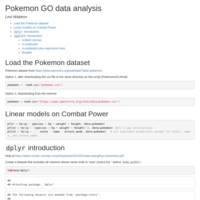
Pokemon GO data analysis with dplyr and ggplot2
BIOS 621 session 3
GLM review, interactions, model matrices

BIOS 621 session 2
Logistic regression as a GLM

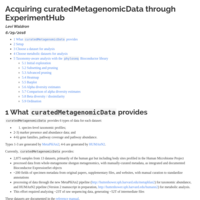
curatedMetagenomicData and ExperimentHub example
A short demonstration of curatedMetagenomicData and ExperimentHub
Statistical analysis for metagenomic data
Focus on exploratory data analysis and regression

Applied Statistics for High-throughput Biology: Session 5
Distances, SVD, PCA, MDS


Applied Statistics for High-throughput Biology: Session 3
Hypothesis testing

Trento Session 1 Lecture
Random Variables
Intro to R
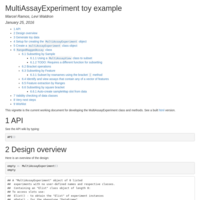
MultiAssayExperiment demonstration vignette
A demonstration of the use of MultiAssayExperiment on a toy dataset
forestplotexample
Case study in meta-analysis of survival-associated genes in ovarian cancer
biocMultiAssay
biocMultiAssay vignette
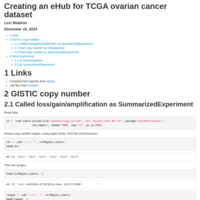
ovc_ehub
Creating an eHub for TCGA ovarian cancer dataset.
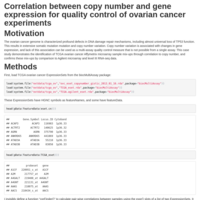
OVC multi-assay QC analysis
Vignette for copy number / expression quality control analysis of TCGA ovarian cancer.
Iris dataset regression examples
for R Bootcamp August 19 2014
Introduction to R graphics
for R Bootcamp August 9, 2014