mgontar
Maksym Gontar
Recently Published

Exploration of Ukrainian EIT-2016 results (MS SQL Server version)
This report aims to explore Ukrainian EIT 2016 results grouped by regions, gender and age factors.
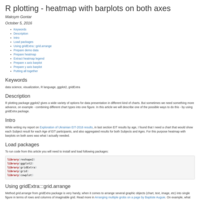
R plotting - heatmap with barplots on both axes
In this article we will describe one of the possible ways to combine different chart types into one figure - by using gridExtra package.
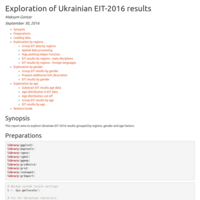
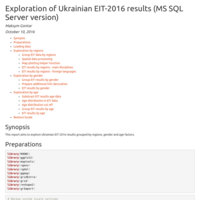
Exploration of Ukrainian EIT-2016 results
This report aims to explore Ukrainian EIT 2016 results grouped by regions, gender and age factors.
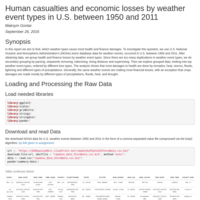
Human casualties and economic losses by weather event types in U.S. between 1950 and 2011
In this report we aim to find, which weather types cause most health and finance damages.