
mharris
Matt Harris
Recently Published
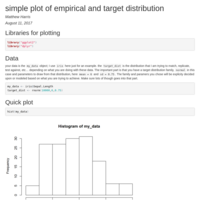
simple plot of empirical and target distribution
simple plot of empirical and target distribution
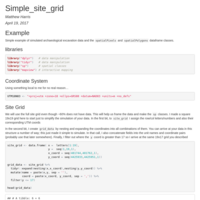
Simple SP Pixel/Polygons dataframe
Simple example of simulated archaeological excavation data and the spatialPixels and spatialPolygons dataframe classes.


lmer random intercept testing
working on code with Mary regarding NULL models for random intercepts
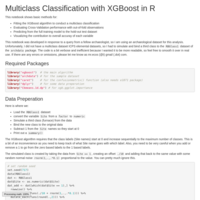
Multiclass Classification with XGBoost in R
This notebook shows basic methods for:
Fitting the XGBoost algorithm to conduct a multiclass classification
Evaluating Cross-Validation performance with out-of-fold observations
Predicting from the full training model to the hold-out test dataset
Visualizing the contribution to overall accuray of each variable
This notebook was developed in response to a query from a fellow archaeologist, so I am using an archaeological dataset for this analysis. Unfortunately, I did not have a multiclass dataset ICPS elemental datasets, so I had to simulate and bind a third class to the RBGlass1 dataset of the archdata package. The code is a bit verbose and inefficient because I wanted it to be more readable, so feel free to smooth it over in real use. If there are any errors or omissions, please let me know as mr.ecos (@t) gmail (.dot) com.
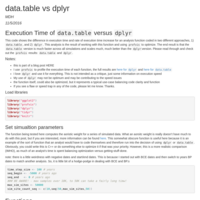
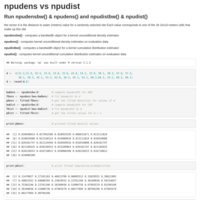
data.table versus dplyr execution time
A quick simulation to test the execution time of a function coded as data.table and dplyr approaches.

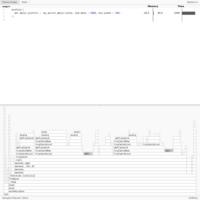
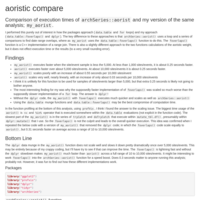
Execution time comparison
I performed this purely out of interest in how the packages approach (`data.table` and `for` loops) and my approach (`data.table::foverlaps()` and `dplyr`). The key difference to these approaches is that `archSeries::aorist()` uses a loop and a series of comparisons to find date range overlaps, where as `my_aorist` uses the `data.table::foverlaps()` function to do this. The `foverlaps()` function is a C++ implementation of a range join. There is also a slightly different approach to the two functions calculations of the aoristic weight, but it does not effect execution time or the results (to a very small rounding error).

facetted color
an example for using different colors by facets
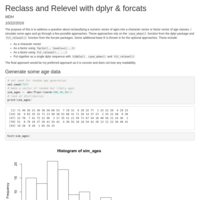
Reclass and Relevel with dplyr and forcats
Some approaches to reclassifying and ordering a numeric vector into a character vector
SAA Seminar - Zubrow Visualization Example
This is an intro to creating ggplot2 visualizations in R. This document supports the only 2hr seminar for R in Archaeology hosted by the Society for American Archaeology on 2016/09/27

SAA Seminar - Bornholm Reproducible Example
This is a brief intro to creating a reproducible markdown in R. This document supports the only 2hr seminar for R in Archaeology hosted by the Society for American Archaeology on 2016/09/27

SAA Seminar - R Mapping Spatial Data
This is a brief intro to mapping spatial data in R. This document supports the only 2hr seminar for R in Archaeology hosted by the Society for American Archaeology on 2016/09/27

SAA Seminar - EDA and Plotting Example
This is a brief intro to EDA and ggplot in R. This document supports the only 2hr seminar for R in Archaeology hosted by the Society for American Archaeology on 2016/09/27
SAA Seminar - RBGlass Machine Learning Example
This is a brief intro to running a machine learning algorithm in R. This document supports the only 2hr seminar for R in Archaeology hosted by the Society for American Archaeology on 2016/09/27
SAA Seminar - R Basic Import
This is a brief intro to importing data into R. This document supports the only 2hr seminar for R in Archaeology hosted by the Society for American Archaeology on 2016/09/27

SAA Seminar - Working with Data in R
This is a brief intro to working with data in R. This document supports the only 2hr seminar for R in Archaeology hosted by the Society for American Archaeology on 2016/09/27
SAA Seminar - R Basic Concepts
This is a brief intro to the basic concepts and syntax of R. This document supports the only 2hr seminar for R in Archaeology hosted by the Society for American Archaeology on 2016/09/27
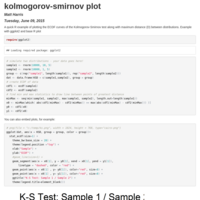
kolmogorov-smirnov plot in R
Quick ggplot2 and base examples showing greatest distance (D) between ECDFs

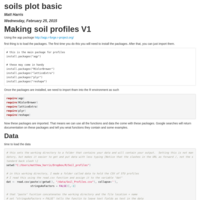
Profiles_in_r
how to make soil profiles with aqp package
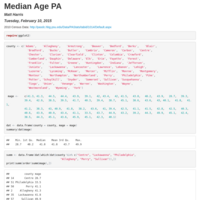
PA_county_median
Quick look at Median age in Pennsylvania Counties from 2010 census data
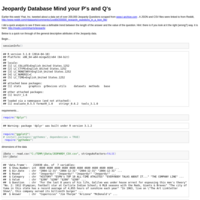
Jeopardy Database Mind your P's and Q's
Earlier this week Yhat, Inc. tweeted about a data set of over 200,000 Jeopardy Questions scraped from www.j-archive.com . A JSON and CSV files were linked to from Reddit, http://www.reddit.com/r/datasets/comments/1uyd0t/200000_jeopardy_questions_in_a_json_file/
I did a quick analysis to see if there was a definable trend between the length of the answer and the value of the question. Hint: there is if you look at it the right (wrong?) way. it is here: http://rpubs.com/mharris/jeopardy
Below is a quick run through of the general descriptive attributes of the Jeopardy data.
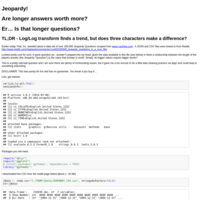
Jeopardy!
Earlier today Yhat, Inc. tweeted about a data set of over 200,000 Jeopardy Questions scraped from www.j-archive.com . A JSON and CSV files were linked to from Reddit, http://www.reddit.com/r/datasets/comments/1uyd0t/200000_jeopardy_questions_in_a_json_file/
Looked pretty cool for sure. A quick question (er.. answer?) popped into my head: given the data available in this file (see below) is there a relationship between the length of the players answer (the Jeopardy “Question”) to the value that answer is worth. Simply, do bigger values require bigger words?
This is a pretty odd-ball question and I am sure there are plenty of confounding issues, but it gave me a fun excuse to do a little data cleaning practice via dplyr and could lead to something interesting.
DISCLAIMER: This was purely for fun and has no guarantee. You break it you buy it…
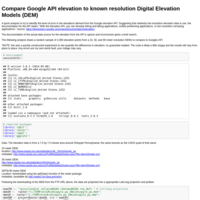
Compare Google API elevation to known resolution Digital Elevation Models (DEM)
A quick analysis to try to identify the level of error in the elevations derived from the Google elevation API. Suggesting that relatively low resolution elevation data is use, the documentation for the API states: “With the Elevation API, you can develop hiking and biking applications, mobile positioning applications, or low resolution surveying applications.” source: https://developers.google.com/maps/documentation/elevation/
Extending Analysis:
The only real issue is the Google API limitations. Using the loop in the analysis, should be easy enough to build large database of random lat/long samples; may take a few days given the 24 hr API limits. Beyond that, it is about finding the DEM data. The SRTM 90m using the raster:::getData() should work worldwide. In the US, 3m, 10m, and 30m elevation data are available (with some variation) from the National Elevation Dataset at http://nationalmap.gov/ . For Pennsylvania, these DEMs and the LiDAR are available from http://pasda.psu.edu . Finally, the only other bottleneck is in data projection. This can be a little tricky to get right (I used raster:::projectRaster() function) and can take a decent amount of computer resources for high resolution DEMs such as LiDAR and 1/9th arcsecond (~ 3m). As far as the code, it will work for extending the analysis, but could be optimized by making a function to compare elevations and estimate error.