
nayefahmad
Nayef Ahmad
Recently Published
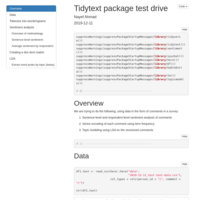
Tidy Text Analysis
Using tidytext and related packages on demo data, in the form of comments in a workplace survey.
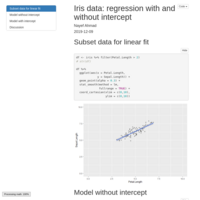
R-squared with and without intercept
Can you compare the R-squared values of two regression models when one of them contains an intercept and the other doesn't? No.

Coin flipping game - do small groups have an advantage/disadvantage
Two groups of people are playing a guessing game. Each individual has to guess the answer to a single question. Although responses are individual, the final results are tallied by group. Does the smaller group have an advantage or disadvantage?
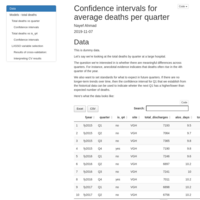
Confidence intervals for averages by quarter
Let’s say we’re looking at the total deaths by quarter at a large hospital.
The question we’re interested in is whether there are meaningful differences across quarters. For instance, anecdotal evidence indicates that deaths often rise in the 4th quarter of the year.
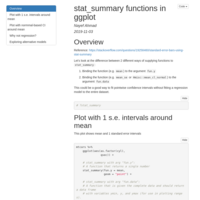
Plotting error bars with stat_summary( ) in ggplot
stat_summary can be used to return either just a single point (using a function such as mean) or it can return a dataframe with y, ymin, and ymax (e.g. when using Hmisc::mean_cl_normal)
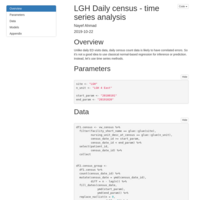
Daily census - time series analysis
Unlike daily ED visits data, daily census count data is likely to have correlated errors. So it’s not a good idea to use classical normal-based regression for inference or prediction. Instead, let’s use time series methods.
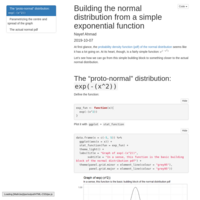
Building the normal distribution from a simple exponential
At first glance, the probability density function (pdf) of the normal distribution seems like it has a lot going on. At its heart, though, is a fairly simple function: exp(-(x^2))
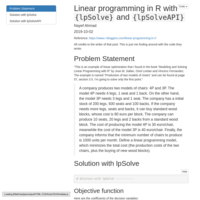
Linear Programming with {lpSolve} and {lpSolveAPI}
R has many packages for optimization and linear programming. I'm trying out two of them here on a simple linear programming problem.
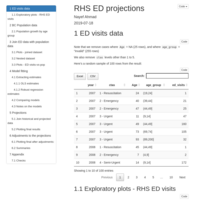
RHS ED visits projections
Demonstrating the approach used for long-term ED visits forecasting, using projected population numbers from BC Stats. These estimates should be taken as a rough estimate, but they do capture heterogeneous behavior across age groups, which is one of the main goals of ED visits projections.
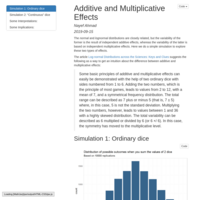
Additive and multiplicative effects
Normal and lognormal distributions are closely related, but the variability of the former is the result of independent additive effects, whereas the variability of the latter is based on independent multiplicative effects. Here we do a simple simulation to explore these two types of effects.
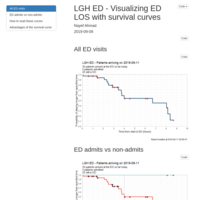
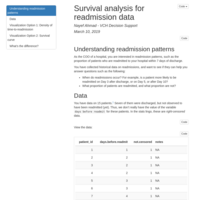
LGH ED - Real-time survival curve for ED length of stay
It's important to track how long patients spend in the emergency department (ED), and ensure that they are treated and discharged within a reasonable amount of time. At any given moment in time, patients may not have an "end time" for their stay in ED, because they are still in the ED. This suggests the use of methods that can deal with censored data in analyzing ED LOS. Here, we use a Kaplan-Meier curve.
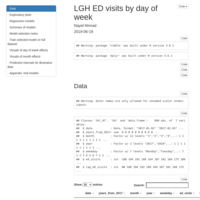
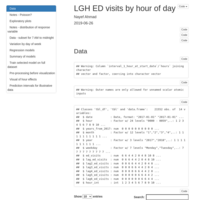
Modeling ED visits by day of week and by month
A simple regression model is reasonably good at explaining some of the variability in daily ED visits using the following predictors: day-of-week, month, and year.
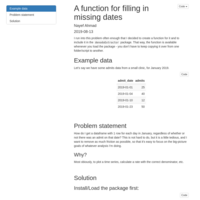
A function for filling in dates
Very often, a time series has no values on many dates. When pulling from databases, this means that there will be no rows associated with those dates. I often need to "fill in" those dates for time series plotting, calculating rates, etc. This function makes it very quick to do that "filling in".
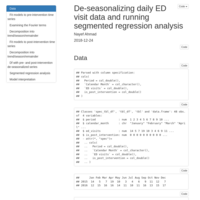
De-seasonalizing a time series and using segmented regression
Segmented regression is used to estimate intervention effects, allowing us to find both immediate and long-term changes due to the intervention. It is best used on de-seasonalized data. Since the data here had less than 24 time points, most de-seasonlizing methods would not work, and we used Fourier components to fit a seasonal model.
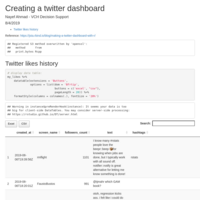
My likes on Twitter
To me, Twitter is for keeping up with the stats/ML/AI/R/Python world. I use this to find interesting content that I've liked before.

CI for binomial proportion
Exploring the "standard" and Wilson CIs for binomial proportion, where the proportion is close to 0.
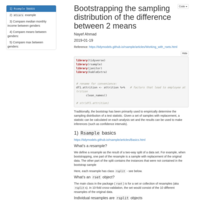
Bootstrapping
Bootstrapping can be used to generate sampling distributions for statistics, and to construct confidence intervals. Here I use the `rsample` package to bootstrap difference between means in two groups.
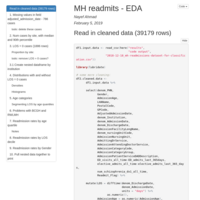
Example exploratory data analysis using RMarkdown
This is an example of how I use RMarkdown docs to organize exploratory data analysis, so that I can keep code, graphs, and notes in one place; and to ensure reproducibility.

Gower's dissimilarity measure for mixed numeric/categorical data
A basic task in data analysis is to compare different entities using a set of measurements on several variables. When the set of variables includes both numeric and categorical variables, Gower's dissimilarity measure is often used.
R for data analysis and modelling - Day 1
In this session, we do some basic data manipulation and visualization.