
rhcarver
Robert H Carver
Recently Published
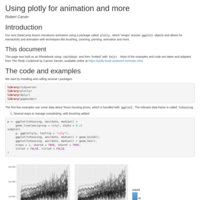
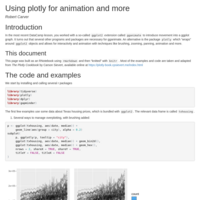
Plotly demo
Markdown document illustrating plotly interactivity and animation

Viz3getdata
For Brandeis IBS Viz 3 assignment: starter notebook to update WDI data.
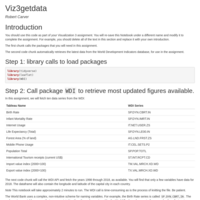
Viz3getdata
Starter Notebook for downloading the latest WDI data, and then completing Viz assignment #3 for BUS240 at Brandeis IBS.
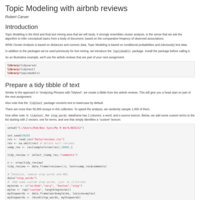
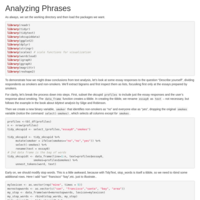
Topic Modeling demo
Intended for students in BUS212 at Brandeis International Business School
Sample output for Visualization Assignment #3
For use by students enrolled in BUS240f2 at Brandeis International Business School, AY 2018-19
More about text analytics
Demo for Stonehill DataSci course, Fall 2017

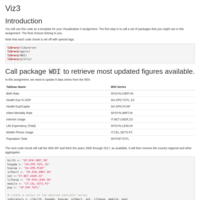
Viz3 demo
template for Visualization assignment #3. IBS BUS240
BUS240 Plotly Demo
Some of the capabilities of plotly
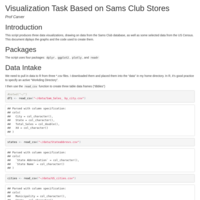
Sam's Club Visualizaitons
Sample visualizations for Individual Tools Assignment, BUS211 Fall 2017
Brandeis International Business School
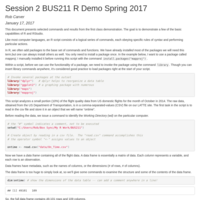
BUS212f2 First R demo
Code for first class meeting of BUS212, Spring 2017
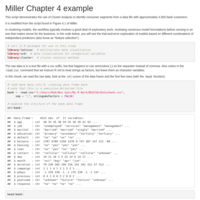
Clustering example -- Chapter 4
Modified and annotated script from Bank clustering example found in chapter 4 of Miller, Marketing Analytics.
For use by students in BUS256 Marketing Analytics, Brandeis University International Business School.
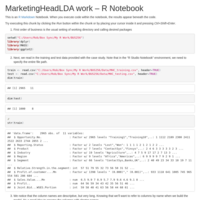
Linear Discriminant Demo for "Marketing Head's Conundrum" case
For use by students enrolled in BUS256 Marketing Analytics at Brandeis University.
BUS211f1 First R Demo
Some commands and graphing capabilities of R, for Brandeis IBS students in BUS211, Spring 2017
Cereal Selector Pitch
Prepared as course project for "Developing Data Products" in Courser's Data Science specialization.
Uses UScereals data from package MASS.
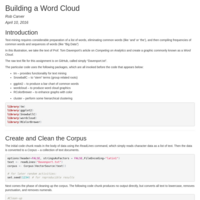
Building a Word Cloud (& more)
Class demo for Session 5 of Big Data II
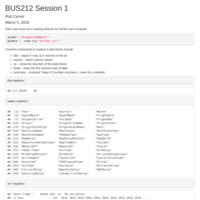
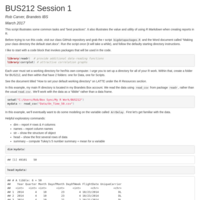
BUS212 Session 1 demo code
Code used in Session # of BUS212 Spring 2016
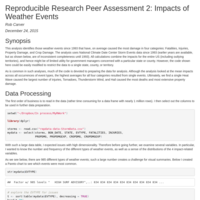
Reproducible Research Peer Assessment 2
Analysis of weather event data and damage caused across the US