
rleedata
R. Lee
Recently Published

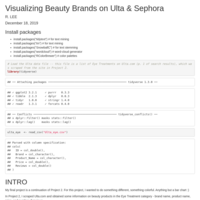
Final Project - Visualizing Beauty Brands on Ulta & Sephora
Part II of Ulta Data Visualizations. A look at Ulta through words. Plus, the intersection of Ulta and Sephora brands.
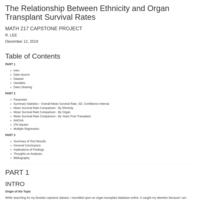
The Relationship Between Ethnicity and Organ Transplant Survival Rates (v1)
MATH 217 Capstone Project, December 2019. This project compares ethnic differences in survival rates for all organ transplants done between 2008-2015 in the U.S. It also examines whether 3 factors -- a recipient's ethnicity, the type of organ transplanted, and the number of years post transplant -- are associated with survival rate.
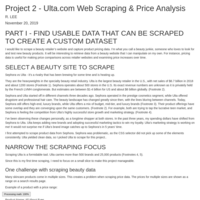
Project 2 - Ulta Web Scraping & Price Analysis
This code scrapes Ulta.com to create a custom dataset of Eye Treatment products. The data includes 4 variables - brand name, product name, price, and number of reviews. The scraped data is cleaned, put into a data frame, and written to a csv file. Final plot shows price vs. number of reviews.
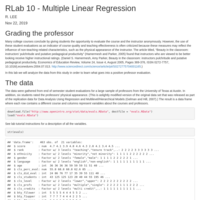
RLab 10 - Multiple Linear Regression
Use multiple regression model to analyze the influence of physical appearance on instructor course evaluation scores. Dataset from Univ. of Texas at Austin.
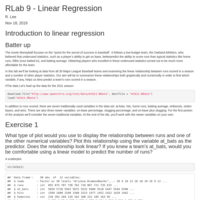
RLab 9 - Intro to Linear Regression
Use linear regression model to determine which variable best predicts baseball success (runs). MLB baseball dataset. Test Moneyball strategy (looking at other variables to predict success).
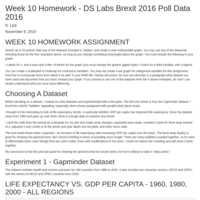
Week 10 Homework - Brexit 2016 Poll Data Shown 3 Different Ways
2016 Brexit poll data shown as: 1) scatterplot with loess curves (ggplot), 2) line graphs superimposed on columns (highcharter), 3) simplified version of the 2nd chart.
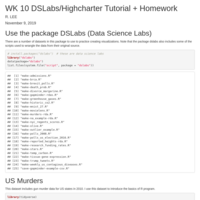
Week 10 Homework - DSLabs/Highcharter Tutorial
using Highcharter package on DSLabs datasets
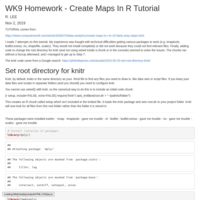
Week 9 Homework - Create Maps In R Tutorial
Tutorial on creating maps in R.
Dataset is 2016 New Hampshire Democratic primary results.
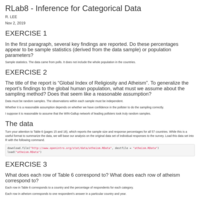
RLab8 - Inference for Categorical Data
Inference of proportions, margin of error, success-failure condition.
Dataset is WIN/Gallup religiosity and Atheism poll.

RLab7 - Inference for Numerical Data
This lab introduces the inference function in R for hypothesis testing or constructing confidence intervals.
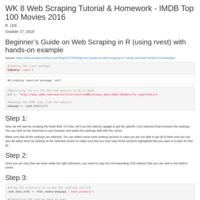
Week 8 Homework - Web Scraping Tutorial - IMDB Top 100 Movies
This tutorial goes over how to scrape movie data from IMDB. Specifically, a single page on the site - Top 100 Movies of 2016. We create 3 plots to analyze the data.
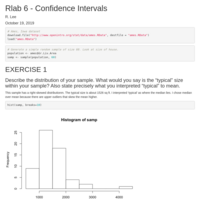
RLab 6 - Confidence Intervals
This OpenIntro lab shows how to calculate and plot a confidence interval.
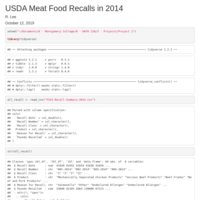
Project 1 - USDA Meat-Based Food Recalls in 2014
This project presents a data visualization from the USDA Food Safety & Inspection Service's 2014 Meat Recall dataset. The barplot shows the reasons for the recall and the total number of pounds of food recalled for each reason. Other charts are shown in this project.
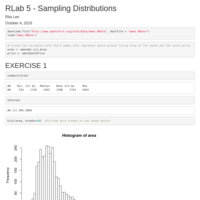
RLab5 - Sampling Distributions
In this lab, we learn how to generate a random sample in R and build a sampling distribution using the for loop.
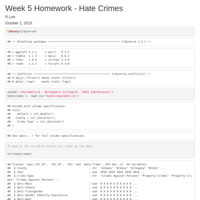
Week 5 Homework - Hate Crimes Tutorial
The plot I created compares Property Hate Crimes and Crimes Against Persons in New York from 2010-2016.
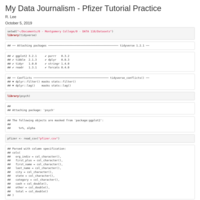
Week 5 - Data Journalism - Pfizer Tutorial
This tutorial covers:
- examining data
- manipulating & analyzing data
- filtering & sortiing data
- grouping & summarizing data
- working with dates
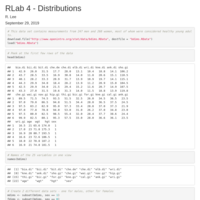
RLab 4 - Distributions
Open Intro Lab 4 -
This R code lab explains how to plot a normal probability curve and evaluate a distribution for normality using Q-Q plot.
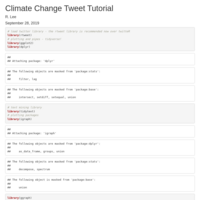
Week 3 Homework - Climate Change Tweet Tutorial
Earth Lab Tutorial for text mining Twitter for climate change tweets. Code executed on September, 28, 2019.
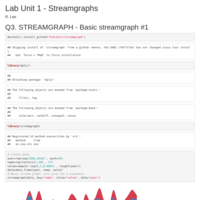
Lab Unit 1 - Streamgraphs
Babynames Version A has been tweaked. It now shows proportions instead of frequency.
NOTE: The graph takes time to load - screen will appear gray while loading.
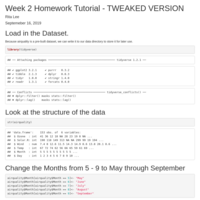
Week 2 Homework - Air Quality TWEAKED VERSION
Minor aesthetic changes to the temperature plots
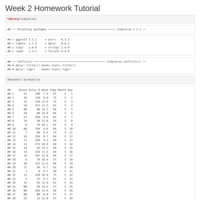
Week 2 Homework - Air Quality ORIGINAL
4 different plots for the temperature data