
robert025
Robert Ruiter
Recently Published
Peer Graded Assignment Week 4
This is a presentation for Coursera's Developing Data Products Week 4
Plotting with Plotly
This is week 3 assignment of Coursera's Developing Data Products.
Goal is a web page presentation with a plot created with Plotly.
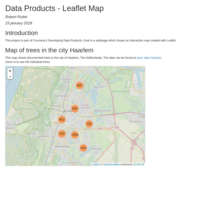
Map of trees Haarlem, NL
This document maps trees of city of Haarlem, The Netherlands.
The document is part of Coursera's Developing Data Products.
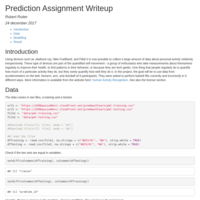
Prediction Assignment Writeup
Human Activity Recognition
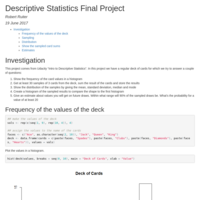
Descriptive Statistics Final Project
Submission for the Final Project of Udacity "Intro to Descriptive Statistics".
Showing frequencies for a deck of cards.
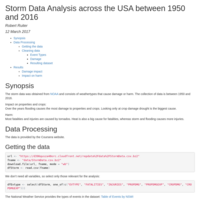
Storm Data Analysis
This document contains the analysis of storm data to show which type of weather event has the biggest impact on economy and does the most harm to people.