
simonnyc
Simon
Recently Published
Wine Sale Prediction
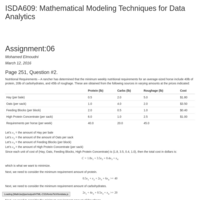
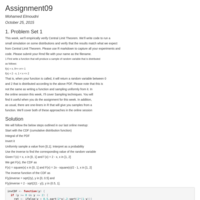
The objective is to build a count regression model to predict the number of cases of wine that will be sold given certain properties of the wine
Neighborhood Crime Prediction
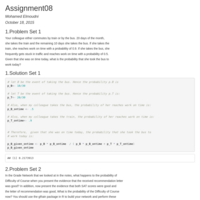
The objective is to build a binary logistic regression model on the training data set to predict whether the neighborhood will be at risk for high crime levels
Auto Accident and Amount Prediction
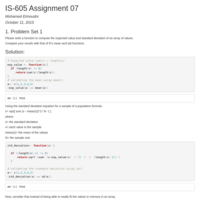
The objective is to build multiple linear regression and binary logistic regression models on the training data
to predict the probability that a person will crash their car and also the amount of money it will cost if the person
does crash their car. You can only use the variables given to you (or variables that you derive from the variables
provided)


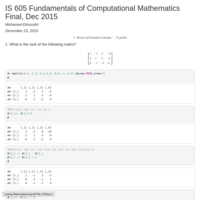
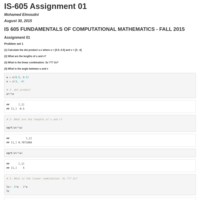
IS 605 Fundamentals of Computational Mathematics Final, Dec 2015
IS 605 Fundamentals of Computational Mathematics Final, Dec 2015


assignment66-answers66
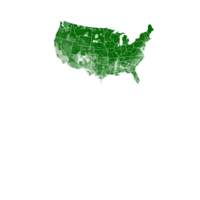
Student Weight Status Category Reporting Results: Beginning 2010
Updated: Feb 28, 2014
The Student Weight Status Category Reporting System (SWSCR) collects weight status category data (underweight, healthy weight, overweight or obese, based on BMI-for-age percentile). The dataset includes separate estimates of the percent of students overweight, obese and overweight or obese for all reportable grades within the county and/or region and by grade groups (elementary and middle/high). The rates of overweight and obesity reported are percentages based on counts of students in selected grades (Pre-K, K, 2, 4, 7, 10) reported to the NYSDOH. Because these rates reflect a broad range of factors that vary by school district, to make comparisons about observed differences in the rates of obesity and overweight between school districts requires the use of multivariate statistics.