
srosales
SERGIO ESTEBAN ROSALES
Recently Published

Pitch of my awesome App
This presentation pitch my awesome app to predict the next word in an incomplete phrase.
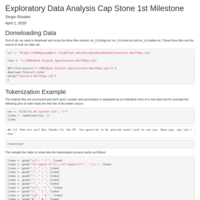
"Exploratory Data Analysis Cap Stone 1st Milestone"
Getting, cleaning, exploring and summary of the Data Set. To develop #-gram analysis.

ShinyApp_PitchPresentation
A presentation to pitch my Shiny App to predict the Eye color.

My Presentation with a Plotly plot
This is a web page presentation using R Markdown that features a plot created with Plotly
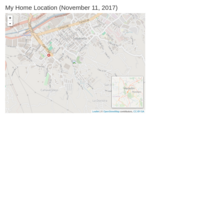
Peer-graded Assignment: R Markdown and Leaflet By Sergio Rosales
map created with Leaflet showing my home location

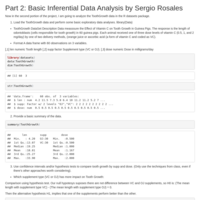
Part 2: Basic Inferential Data Analysis by Sergio Rosales
Statistical Inferece Coursera class
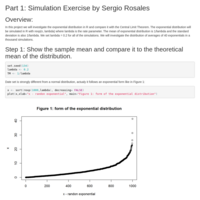
Part 1: Simulation Exercise by Sergio Rosales
Statistical Inference class in Coursera
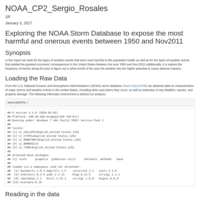
NOAA_CP2_Sergio_Rosales
In this report we seek for the types of weather events that were most harmful to the population health as well as for the types of weather events that yielded the greatest economic consequences in the United States between the year 1950 and Nov./2011.Additionally, it is explore the frequency of events along the year to figure out in what month of the year the weather has the higher potential to cause adverse impacts.