tgwilson
Tim Wilson
Recently Published
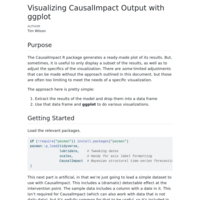
Visualizing CausalImpact Output with ggplot
The CausalImpact R package generates a ready-made plot of its results. But, sometimes, it is useful to only display a subset of the results, as well as to adjust the specifics of the visualization. There are *some* limited adjustments that can be made without the approach outlined in this document, but those are often too limiting to meet the needs of a specific visualization.
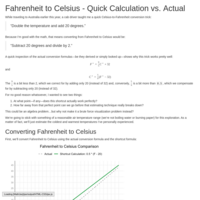
Fahrenheit to Celsius Conversion: a Trivial Exploration
An exploration that could have been performed very quickly in a simple spreadsheet, but was done (still pretty quickly) with R instead. All it does is explores how far off the shortcut calculation for estimating a Fahrenheit temperature from a Celsius temperature is by simply doubling the Celsius temperature and adding 20 degrees.
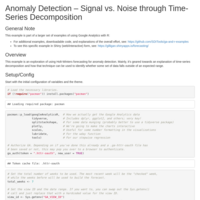
Time-Series Decomposition and Forecasting for Anomaly Detection
This example is an exploration of using Holt-Winters forecasting for anomaly detection. Mainly, it's geared towards an explanation of time-series decomposition and how that technique can be used to identify whether some set of data falls outside of an expected range.
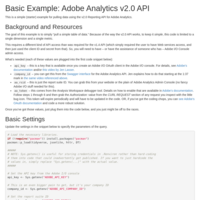
Adobe Analytics API v2.0 -- A Simple Example Using R
This is a basic example of pulling data from the Adobe Analytics v2.0 API using R. It supports pulling just a single dimension and a single metric.
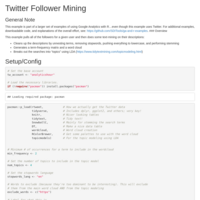
Twitter Follower Mining with R
An example of doing some light text mining on a Twitter user's followers based on their profile descriptions
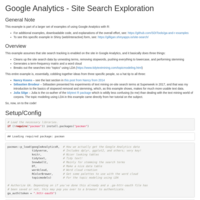
Google Analytics: (Light) Mining of Text Search
An example of doing some text mining of Google Analytics on-site search data.
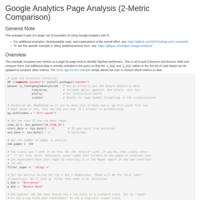
Google Analytics: Page Analysis Comparing Two Metrics
An example of comparing pages on a scatterplot by assessing two different metrics for each page at once.
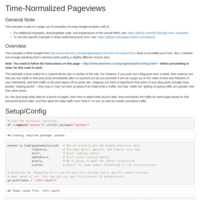
Google Analytics: Time-Normalized Pageviews by Page
An example of identifying tortoise vs. hare content on the site by not getting too enamored with how much traffic a page garners immediately following its launch.
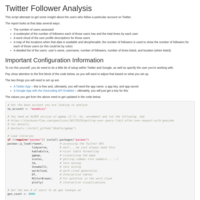
Twitter Follower Analysis for @moemkiss
Playing around with the Twitter API and the Google Maps Geocoding API. And R.
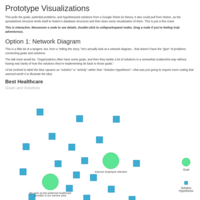
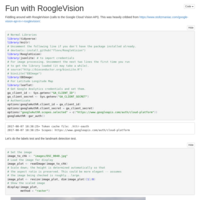
Data Ecosystem Visualization
An illustration of a data ecosystem by way of an interactive network diagram built from a Google Sheets document.
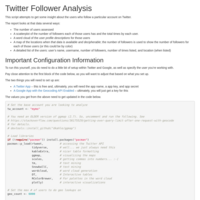
Twitter Follower Analysis for @mymo
A light analysis of Twitter followers using data from the Twitter API and the Google Maps Geocoding API.
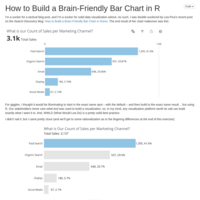
How to Build a Brain-Friendly Bar Chart in R
An exercise in matching a bar chart built in Domo and then "made over" by data visualization guru Lea Pica (in Domo). This document builds the same chart using ggplot2 in R.
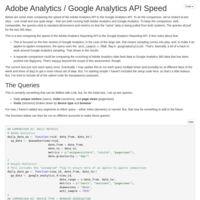
Google Analytics API vs. Adobe Analytics API
This is a simple little head-to-head test on a couple of sites to see the differences in the speeds with which Google Analytics and Adobe Analytics return data through their respective APIs.
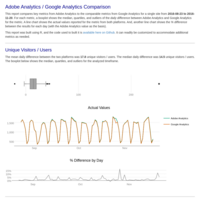
Adobe Analytics / Google Analytics Comparison
This report compares key metrics from Adobe Analytics to the comparable metrics from Google Analytics for a single site using data pulled using the RSiteCatalyst and googleAnalyticsR packages. For each metric, a boxplot shows the median, quartiles, and outliers of the daily difference between Adobe Analytics and Google Analytics for the metric. A line chart shows the actual values reported for the metric from both platforms. And, another line chart shows the % difference between the results for each day (with the Adobe Analytics value as the basis).

A Quick Demo of R for Digital Analytics (Google Analytics)
A slideshow build with RMarkdown as part of a session at eMetrics Berlin in November 2016. The intent was to provide a glimpse into the code required to access data through the Google Analytics API (using the googleAnalyticsR package) and then do some basic manipulation and visualization of the data.