
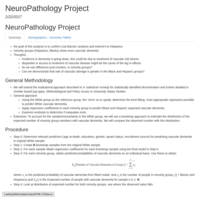
useR_Teresa
Teresa Filshtein
Recently Published
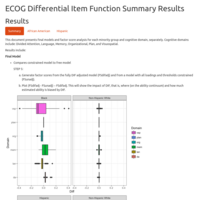

ECOG Diff Analysis
Summary of final results
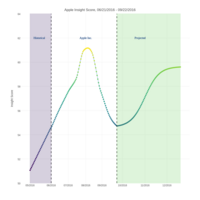
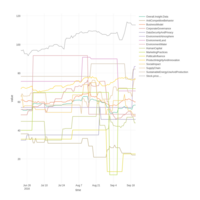
Hype Curve
loess fit
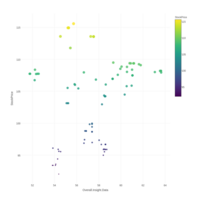
Stock Price vs Insight Score
Stock Price: Size/Color
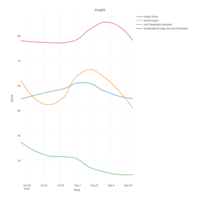
Insight Components
Smoothed loess lines fit to the data
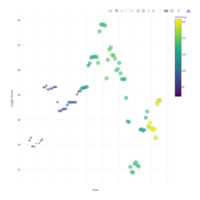
Insight Score
Stock Price: Size Color
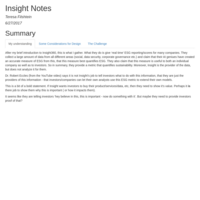
Insight Notes
Some late night thoughts and ideas. Let's talk tomorrow!
Fletcher Results
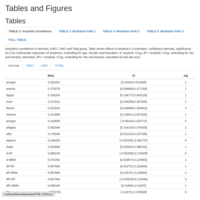
Tables for Fletcher Results
Results Table
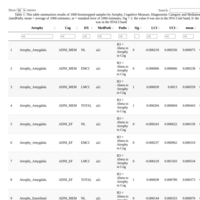
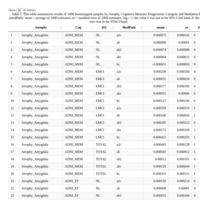
Table 1: This table summarizes results of 1000 bootstrapped samples by Atrophy, Cognitive Measure, Diagnosistic Category and Mediation Path (medPath).
mean = average of 1000 estimates, se = standard error of 1000 estimates, Sig = 1: the value 0 was not in the 95% Conf band, 0: the value zero was in the 95%CI band
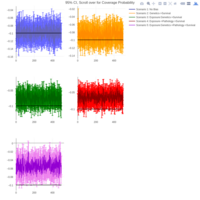
Example 3: Coverage
95% CI for each estimated slope and each simulation. Scroll over for total coverage probability in each Scenario.
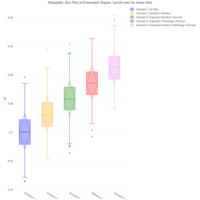
Example 2: Simulation, Estimation Reliability
Box plot of estimated education slope for each simulation. Displays the spread of the estimated slope for each scenario
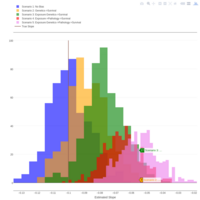
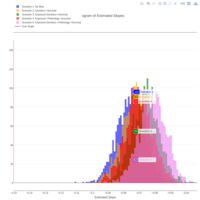
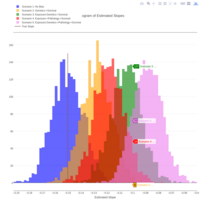
Example 1: Histogram of slope estimates
Histogram of estimated slope of education:time under different scenarios
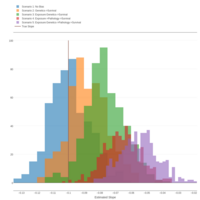
Sample Plot
Sample plot. Histogram of Estimated Education Slope for each Scenario
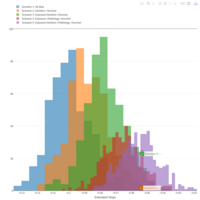
TestRun Plotly
Testing some plots for the simulation results