
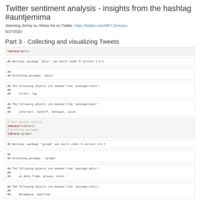
utjimmyx
zhenning xu
Recently Published


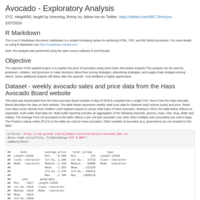
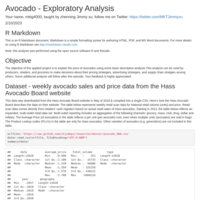
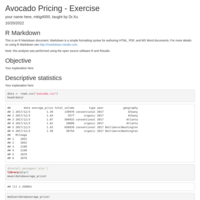
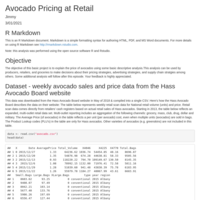
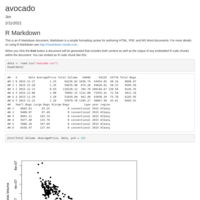
Avocado - Exploratory Analysis
My 3rd week lab submission.


Christmas_Tree_2023
This Christmas tree is designed using the ggplot2 package available in R.

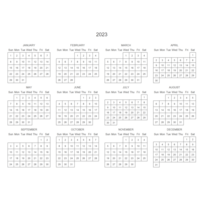
Calendar 2023
This calendar is made using the package "calendR". See the tutorial here:https://r-coder.com/calendar-plot-r/


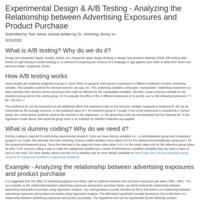
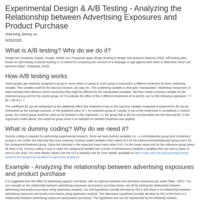


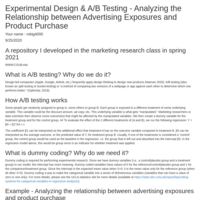
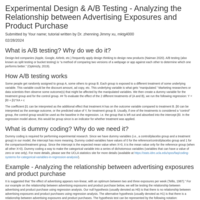
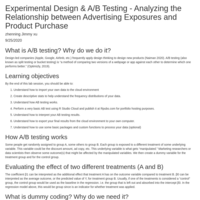
AB testing
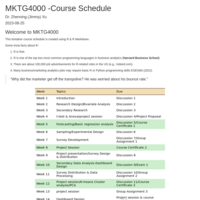
MKTG4000, csub

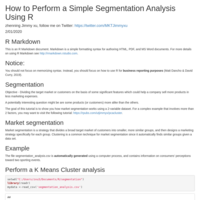
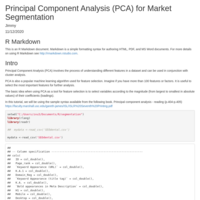


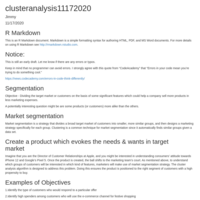
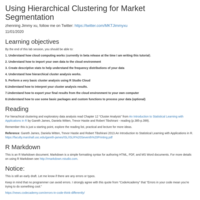
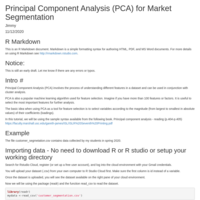
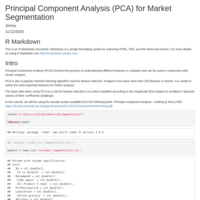
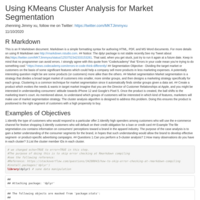
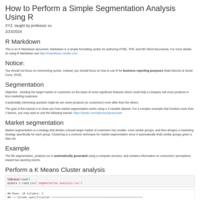
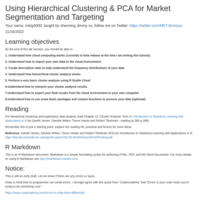
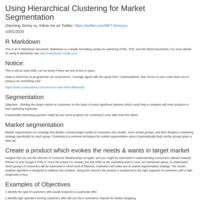
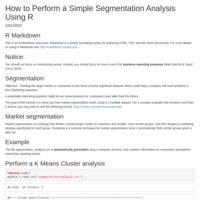
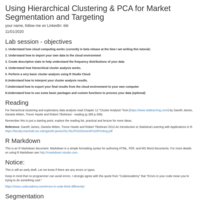
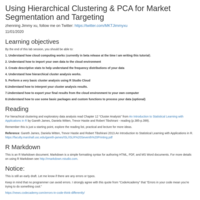
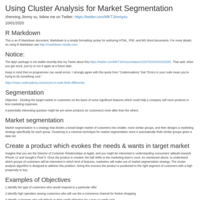
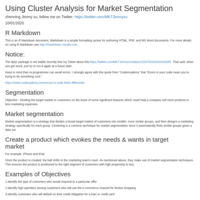
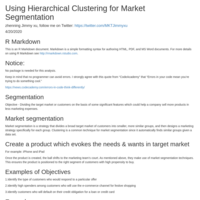
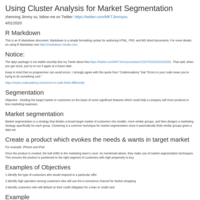
Kmeans clustering using the dataset consumer_segmentation.csv
Kmeans clustering using the dataset consumer_segmentation.csv

Presentation - Topic modeling1
For the BPA Faculty research symposium on Feb 28, 2020
Presentation - Topic modeling
For the BPA Faculty research symposium on Feb 28, 2020
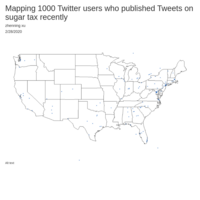
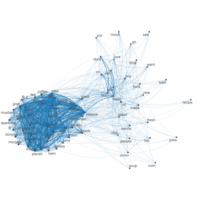
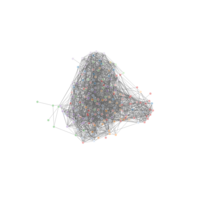
Mapping 1000 Twitter users
For the BPA Faculty research symposium on Feb 28, 2020
Presentation - Topic modeling1
For the BPA Faculty research symposium on Feb 28, 2020

Presentation - Word Prediction App
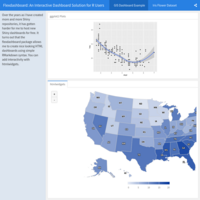
The goal of this project is to create a dashboard (app) to provide an interface that can be used to make predictions based on natural language processing algorithms. This slide deck consists of slides pitching the algorithm and the app.


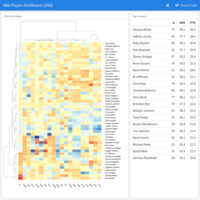
Using webscrapping and visualization to analyze NBA games
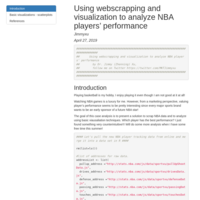
Playing basketball is my hobby. I enjoy playing it even though I am not good at it at all!
Watching NBA games is a luxury for me.However, valuing player’s performance predicting a future star seems to be pretty interesting!
The goal of this case analysis is to present a solution to scrap NBA data and to analyze using basic viausaliation techniques. Which player has the best performance? I just found something very counterintuitive!!! Will do some more analysis when I have some free time this summer!
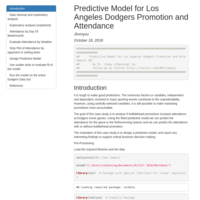
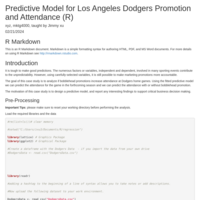
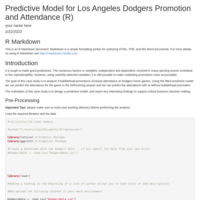
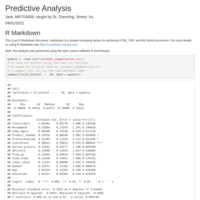
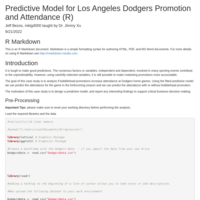
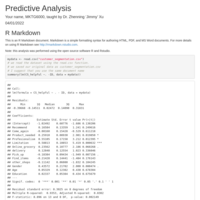
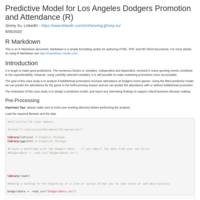
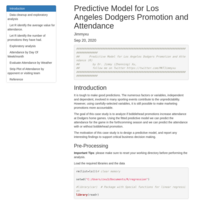
Predictive Model for Los Angeles Dodgers Promotion and Attendance
It is tough to make good predictions. The numerous factors or variables, independent and dependent, involved in many sporting events contribute to the unpredictability. However, using carefully-selected variables, it is still possible to make marketing promotions more accountable.
The goal of this case study is to analyze if bobblehead promotions increase attendance at Dodgers home games. Using the fitted predictive model we can predict the attendance for the game in the forthcomming season and we can predict the attendance with or without bobblehead promotion.

Marketing is fun - ADMSSC- AMA
This YouTube video event is designed to challenge undergraduate students to interview a marketing manager or promote a new idea or a product. This year, we got 4 YouTube video submissions. Among them, three are from Jimmy Xu's Intro to Marketing class, and one is from Professor Carl Blue’s Technology Management class.
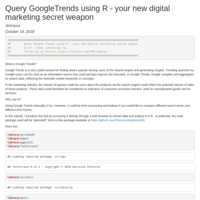
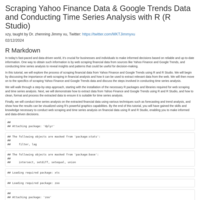
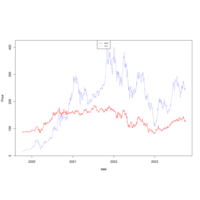
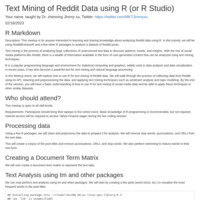
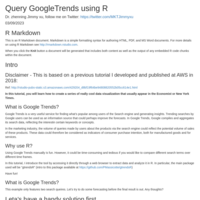
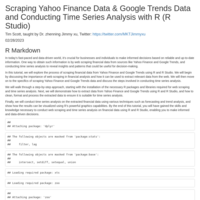
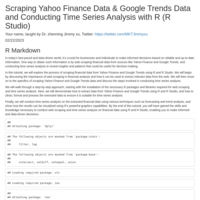
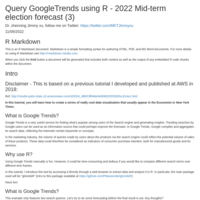
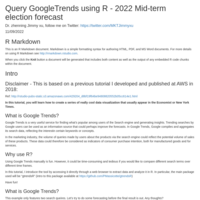
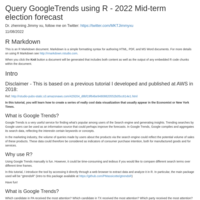
Query Google Trends using R - your new digital marketing secret weapon
In this tutorial, I introduce the tool by accessing it directly through a web browser to extract data and analyze it in R. In particular, the main package used will be “gtrendsR” (intro to this package available at https://github.com/PMassicotte/gtrendsR)