
Aderbak
Andrew Derbak
Recently Published
JHU DDP Week 3 Assignment - Plotly
Interactive 3d scatter-plot of the mtcars data set showing the relationship between 4 variables: miles per gallon, displacement, weight, and number of cycles. Created as my project for the Johns Hopkins Data Science Specialization program: Developing Data Products
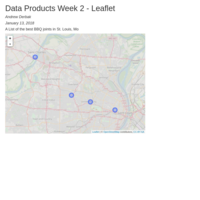
JHU Data Products Week 2 - Leaflet
My Leaflet example showcasing the best bbq places in St. Louis, Mo
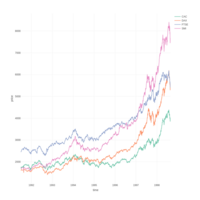
EUStockMarket PlotLy Practice
Example Line Graph using PlotLy in R.
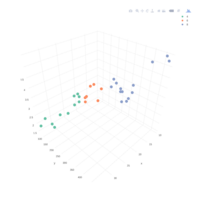
MtCars Plotly Practice
An example of a 3d Scatterplot using the mtcars dataset in R
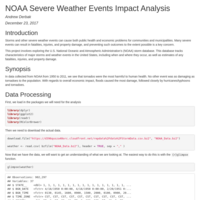
NOAA Severe Weather Events Impact Analysis
This is submitted as my Reproducible Research Week 4 Project. It involves analysis of storm events data regarding population health and economic impact.