
basbagill
John Basbagill
Recently Published


Plotly Assignment
Interactive plot on a presentation plotting time-series carbon data.
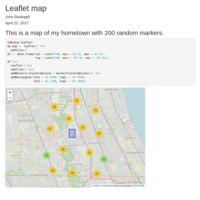
Leaflet Assignment - April 22, 2017
This is an interactive map of my hometown with a rectangular box drawn on it.

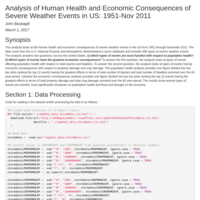
Reproducible Research Week 4 Project
This analysis looks at the effects of severe weather events on population health and the economy in the US from 1951 through November 2011.