
Evan_Jung
JIHOON JUNG
Recently Published
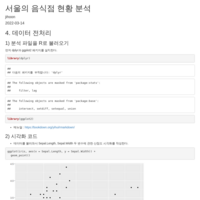
서울 음식점 현황 분석
dddddd
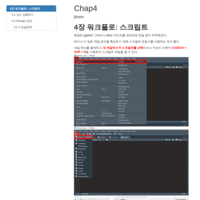
ch04~
aaa
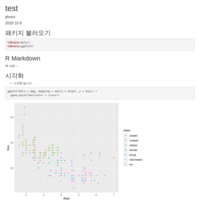
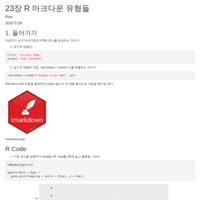
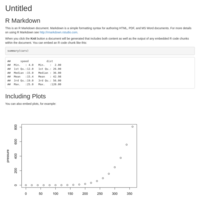
R Markdown
첫번째 R마크다운 문서입니다.

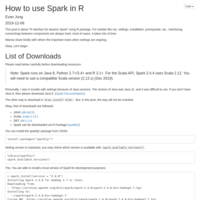
How to use Spark in R
This post is about “R interface for Apache Spark” using R package. For newbie like me, settings, installation, prerequisite, etc.. interfacing, connectings between components are always hard, most of cases, it takes lots of time.
Wanna share kindly with others the important notes when settings are ongoing.
Okay, Let’s begin.
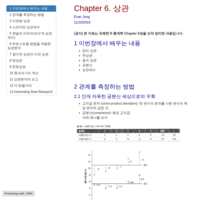
상관관계 분석
유쾌한 R 통계학의 상관관계분석을 정리하였습니다.
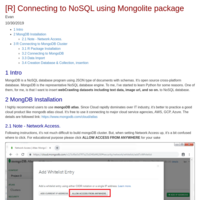
[R] Connecting to NoSQL using Mongolite package
MongoDB is a NoSQL database program using JSON type of documents with schemas. It’s open source cross-platform database. MongoDB is the representative NoSQL database engine. To me, I’ve started to learn Python for some reasons. One of them, for me, is that I want to insert webCrawling datasets including text data, image url, and so on. to NoSQL database.
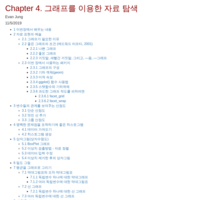
유쾌한 R 통계학 4장 - 그래프를 이용한 자료탐색
(공지) 본 자료는 [유쾌한 R 통계학] Chapter 4장을 요약 정리한 내용입니다.
이번장에서 배우는 내용
- 자료를 탐색할 때는 지도가 없다.
- 로젠탈(Rosenthal): 연구자는 자료를 친구로 삼아야 한다.
- 연구자가 분석을 서두를 때가 많은데, 분석을 서두른다는 것은 포도주를 병째로 들이키는 것과 같다. 그러면 뒤죽박죽 비일관적인 결과가 나온다. 자료를 제대로 탐색하려면 지도가 필요한다, 자료의 지도를 그래프라고 부른다.....
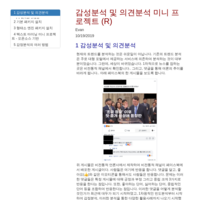
Sentiment_Analysis
감성분석을 처음 접하신 분들을 위해 만들었습니다. 주요 패키지 설치 및 소개, 데이터 수집, 전처리, 시각화, 그리고 감성분석까지 기본 가이드라인을 만들었습니다.
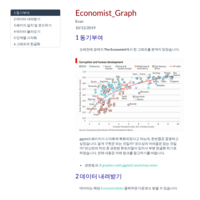
Drawing The Economist Graph using ggplot2
ggplot2 패키지를 활용하여 The Economist 경제지에 나오는 그래프를 작성하는 예제를 구현하였습니다.
00여성인력개발센터 프로젝트-Sample
해당 문서는 수강생들을 위해 만든 임시 문서입니다.

R with Google Drive
R과 구글드라이브를 연동하여 파일을 관리하는 간단한 소개글입니다.
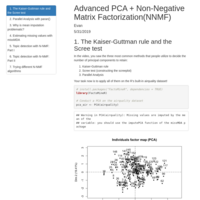
Advanced PCA & Non-negative matrix factorization (NNMF)
Here, you'll build on your knowledge of PCA by tackling more advanced applications, such as dealing with missing data. You'll also become familiar with another essential dimensionality reduction technique called Non-negative matrix factorization (NNMF) and how to use it in R.
Principal component analysis
As a data scientist, you’ll frequently have to deal with messy and high-dimensional datasets. In this chapter, you’ll learn how to use Principal Component Analysis (PCA) to effectively reduce the dimensionality of such datasets so that it becomes easier to extract actionable insights from them.
Evaluating your measure with factor analysis
you will learn how to conduct an EFA to examine the statistical properties of a measure designed around one construct.
Exploratory factor analysis (EFA)
Become familiar with exploratory factor analysis (EFA), another dimensionality reduction technique that is a natural extension to PCA.
범주형 데이터에 대한 계층적 군집분석접근
이번 포스팅은 클러스터링 모델링을 수행하는 저의 첫 시도이며, 또한 매우 귀중한 경험이었습니다. 고객사의 데이터를 공개할 수는 없지만, 범주형 변수가 많은 데이터였습니다. 숫자 변수를 이용한 예제는 비교적 쉽게 확인할 수 있겠지만, 범주형 위주의 데이터 관련 예제는 많지가 않아서 조금 고생하였습니다.
내용을 찾다보니, 범주형 데이터를 클러스터링 하는 영역에 대해 합리적인 결과 도출이 안될수도 있다는 굉장히 생산적인 토론 내용을 접하기도 하였습니다.....
The reduction in weekly working hours in Europe
They say that a picture is worth a thousand words. Indeed, successfully promoting your data analysis is not only a matter of accurate and effective graphics, but also of aesthetics and uniqueness. This course teaches you how to leverage the power of ggplot2 themes for producing publication-quality graphics that stick out from the mass of boilerplate plots out there. It shows you how to tweak and get the most out of ggplot2 in order to produce unconventional plots that draw attention on social media. In the end, you will combine that knowledge to produce a slick and custom-styled report with RMarkdown and CSS – all of that within the powerful tidyverse.
DataCamp: https://www.datacamp.com/courses/communicating-with-data-in-the-tidyverse
On Decision to end DACA, Comments by Facebook CEO
Simple Text Mining Project
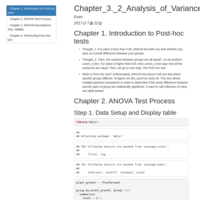
Chapter_3._3_Analysis_of_Variance - Between Groups Factorial ANOVA
Learning One-Way ANOVA Test in R (ref. http://www.sthda.com/) and in Datacamp (https://www.datacamp.com/home)
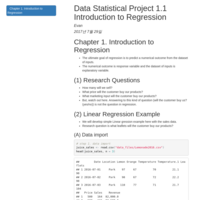
Data Statistical Project 1.1 Introduction to Regression
Learning from https://www.datacamp.com/courses/supervised-learning-in-r-regression & books, Statistics an introduction using R.
It is simple summary but will be very helpful to use this method
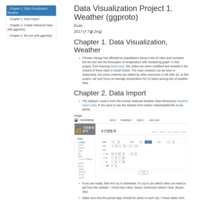
Data Visualization Project 1. Weather (ggproto)
Learned from Datacamp, and try to apply into Korean Weather. ggproto is awesome
Chapter_3._2_Analysis_of_Variance
Learning One-Way ANOVA Test in R (ref. http://www.sthda.com/) and in Datacamp (https://www.datacamp.com/home)
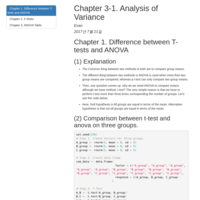
Chapter 3-1. Analysis of Variance
Learning Statistics An Introduction Using R by MJ. Crawley
Chapter 1-3. Basic to Statistics (Independent Test)
Learning Statistics An Introduction Using R by MJ. Crawley
Chapter 1-2. Basic to Statistics
Learning Statistics An Introduction Using R by MJ. Crawley
Chapter 1-1. Basic to Statistics
Learning Statistics An Introduction Using R by MJ. Crawley
Chapter 2. Dataframes
Learning statistics using R via statistics an introduction using r 2nd edition written by MJ Crawley
Correlation_Analysis_Mercedes_2017
“Is Weight(wt) negatively correlated with Miles/(US) gallon (City_MPG) over all the car types?”
“Is Weight(Wt) negatively correlated with Miles/(US) gallon (City_MPG) over all the cylinders?”
The answer is...
Oh SeungHwan's Pitch Analysis (2017)
Chapter-1, Exploring Velocity of Oh SeungHwan's pitch