
anish20
Anish Singh Walia
Recently Published
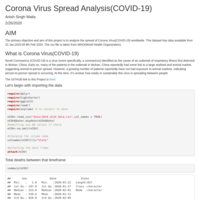
Analysing Corona Virus Spread Worldwide
The primary objective and aim of this project is to analyze the spread of Corona Virus(COVID-19) worldwide. Which countries and States were most affected by this virus within this time frame. This dataset has data available from 22 Jan 2020 till 9th Feb 2020. The CSV file is taken from the WHO(World Health Organization).
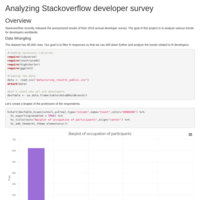
Analyzing Stack Overflow Developer's Survey Data
This Markdown document contains some analysis of Stack Overflow Developer Survey data.

Heart disease prediction using SVM classifier
In the following document, I will be using SVM classification techinque to predict heart disease (angiographic disease status). From a set of 14 variables, the most important to predict heart failure are whether or not there is a reversable defect in Thalassemia followed by whether or not there is an occurrence of asymptomatic chest pain.
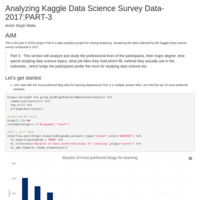
Kaggle Data science survey data analysis-Part 3
This section will analyze and study the professional lives of the participants, their major degree ,time spend studying data science topics, what job titles they hold,which ML method they actually use in the industries , which blogs the participants prefer the most for studying data science, what the participants think about the most necessary skills for a data scientist etc
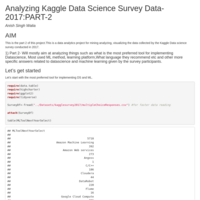
Analyzing Kaggle Data science survey data-Part 2
This part will mostly aim at analyzing things such as what is the most preferred tool for implementing Datascience, Most used ML method, learning platform,What language they recommend etc and other more specific answers related to data-science and machine learning given by the survey participants
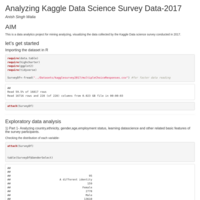
Analyzing Kaggle Data science survey data-Part 1
This is a data analytics project for mining analyzing, visualizing the data collected by the Kaggle Data science survey conducted in 2017. This part specifically focuses on some variables such as country of origin , gender, employment status etc attributes of the participants.
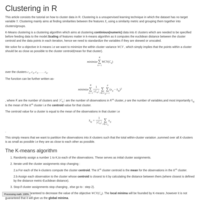
K means clustering
This article describes the concept behind k-means clustering algorithm and talks about its merits and demerits.Then fake data is generated in order to demonstrate about how to cluster data in R using K-means algorithm.
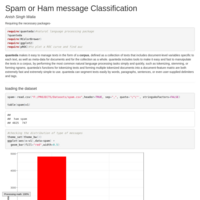
Text Message Classification-Spam or Ham
Classify messages as Spam or Ham using a simple Naive Bayes classifier and some natural language processing.
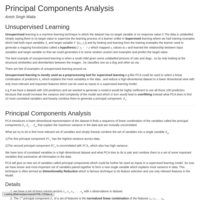
Principal Components Analysis on USArrests dataset
This article explains the maths behind principal components analysis which is a famous dimentionality reduction technique and a famous pre-processing tool for supervised learning.The article also gives an example on how to implement it in R.
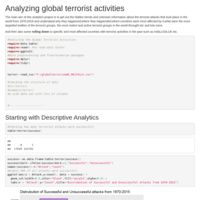
Analyzing Global Terrorist Activities
This is the analysis and report of all the terrorist activities that took place throughout the globe form 1970-2016.It mainly aims at answering questions such as which -"country had most number of attacks","which countries had most successfully executed terrorist attacks" , then rolling down to countries such as India and drilling all the terrorist activities that took place in India etc.
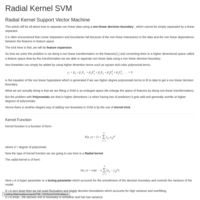
Radial kernel Support vector machine
This article gives a good overview of radial kernel and the use of kernel trick in SVM to apply non linear transformation to non linearly separate the data and generate non linear decision boundaries.
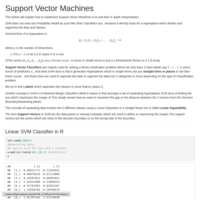
Linear Kernel Support Vector Classifier
This articles includes an abstract view of what Support Vector Machines are and at the same time implementation of a Linear Support Vector Machine in R which is used to linearly separate the data .
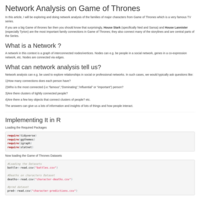
Network Analysis of Game of Thrones(Part 1)
Network Analysis is the study of relationships and dependencies between objects . I will use Directed Acyclic Graphs to plot the relationships in R.
This is Part 1 of the complete Project because this is quiet a big one and specifically in this Article we first process, transform and scrape data and prepare it for feeding it to the Graphs and plot Directed Acyclic Graphs of Families and GOT houses.
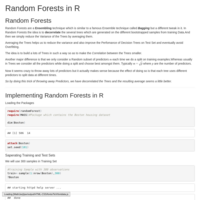
Implementing Random Forests to predict Median Housing Values
Random Forest is a Ensembling technique which is similar to a famous Ensemble technique called Bagging but a different tweak in it. In Random Forests the idea is to Decorrelate the several trees which are generated on the different bootstrapped samples from training Data.And then we simply reduce the Variance of the Trees by averaging them.In this example I am trying to predict the median housing values from the Boston housing data set.
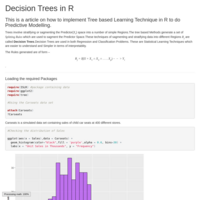
Using Decision Trees to predict the High Sales of cars
Trees involve stratifying or sagmenting the Predictor($X_i$) space into a number of simple Regions.The tree based Methods generate a set of $Splitting \ Rules$ which are used to sagment the Predictor Space.These techniques of sagmenting and stratifying data into different Regions $R_j$ are called __Decision Trees__.
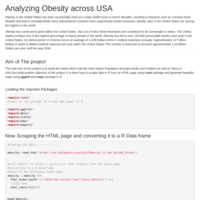
Analyzing Obesity in USA and Scraping Data in R
The main aim of this project is to study the states which had the most Obese Population amongst Adults and Children as well as Teens in USA.Secondly,another objective of this project is to learn how to scrape data in R from an HTML page using rvest package and generate beautiful maps using ggplot and maps package in R.
Digit Recognition in R
This is a short presentation on how to implement Deep learning in R using Keras and Tensorflow packages in R.I did Digit Recognition on MNIST datset .
And the results were quiet good.
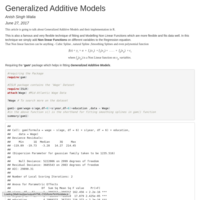
Predicting Wage of employees using Generalized Additive Models
This article talks about implementing Generalized additive Models in R and how they can help us to capture Non linear interactions in the data and generate linear models which are Non linear in their predictors(X) to capture non linearities between input and output variables.It also talks about the Mathematical from of the Generalized Additive Models and how they are different form others.In this example I predict the salaries of employees as a function of age,years of experience and education .
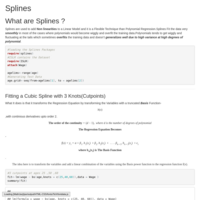
Cubic and Smoothing Splines
This article gives a step by step tutorial on implementing Smoothing Splines and cubic Splines and the various Mathematical forms used in these methods to add and learn Non Linear Functions.
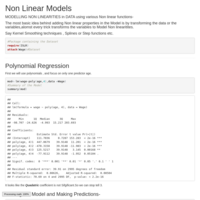
Non Linear Models in R
This is a document consisting of techniques which show step by step implementation of Polynomial Regression in R i.e fitting Non Linear Models which are more flexible and help us to model Non linearities in Data easily.
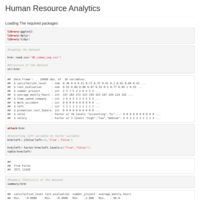
Human Resource Analytics
This is a Human Resource Analytics project which mainly focuses on Descriptive analytics of the data,using various statistical methods and lots of data visualizations and plots , and use of R packages such as 'dplyr' , 'tidyr' and 'ggplot2'. The data set is downloaded from Kaggle and is a artificial human resource dataset. But still it covers every answers to all the questions one can think from analyzing a HR data of a firm.