
benjaminhaley
Benjamin Haley
Recently Published
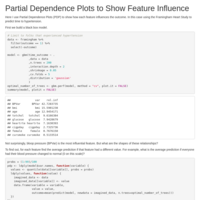
Partial Dependence Plots to Show Feature Influence
Here I use Partial Dependence Plots (PDP) to show how each feature influences the outcome. In this case using the Framingham heart study to predict time to hypertension.
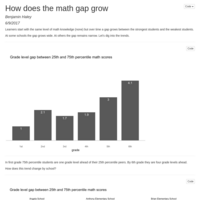
How does the math gap grow
Learners start with the same level of math knowledge (none) but over time a gap grows between the strongest students and the weakest students.
At some schools the gap grows wide. At others the gap remains narrow. Let's dig into the trends.
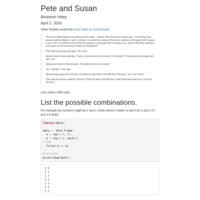
Pete and Susan
The answer to Oliver Roeder's Riddle on fivethirtyeight [1].
[1]:http://fivethirtyeight.com/features/can-you-solve-the-impossible-puzzle/

Publish Document
Code folding example.
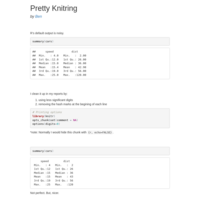
Pretty knitring
Making output nicer in R markdown.

hello magrittr
The forward piping operator, %>%, allows us to avoid intermediate variables and indent code nicely, making life easier for the reader.
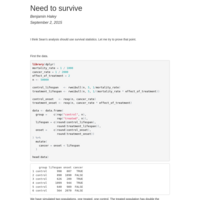
Need to survive
I think Sean’s analysis should use survival statistics. Let me try to prove that point.
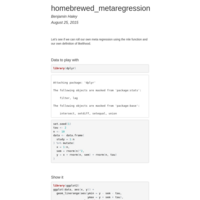
Homebrewed metaregression
We can roll our own meta regression using the mle function and our own definition of likelihood.
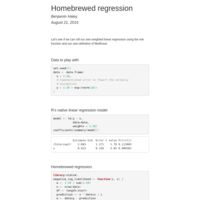
Homebrewed weighted regression
Let's see if we can roll our own weighted linear regression using the mle function and our own definition of likelihood.
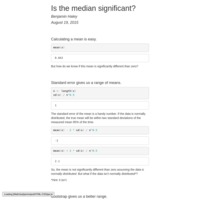
Is the median significant?
Test whether a median is significantly different than zero without using bootstrap.
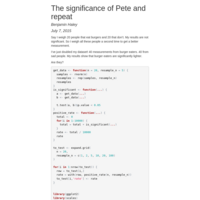
The significance of Pete and repeat
Why repeated sampling leads to false positives.
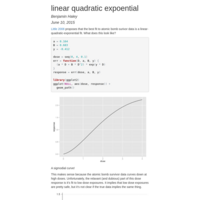
Dose response for atomic bomb survivors
[Little 2008] proposes that the best fit to atomic bomb survivor data is a linear-quadratic-exponential fit. What does this look like?
[Little 2008]: http://www.jstor.org/stable/30119601
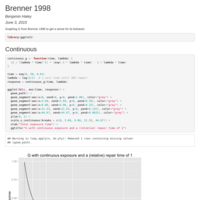
Brenner's G
The radiation reduction factor from Brenner 1996. Let's see how it works.
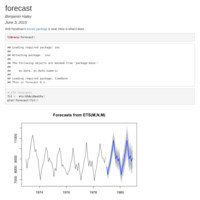
Forecast
Rob Hyndman's forecast package is neat.
interact.gbm
Exploring the interact.gbm function to find interactions in a gbm model.
GBM can!
(but perhaps its buggy)
Publish Document
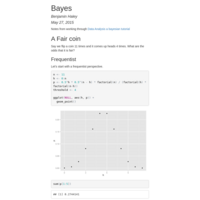
Notes from working through Data Analysis: A Bayesian Tutorial [1].
[1]: http://www.cogsci.northwestern.edu/Bayes/Sivia_1996.pdf
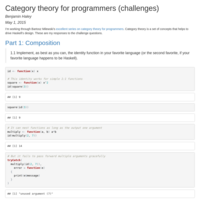
Category theory for programmers (challenges)
I’m working through Bartosz Milewski’s excellent series on category theory for programmers [1]. Category theory is a set of concepts that helps to drive Haskell’s design. These are my responses to the challenge questions.
[1]: http://bartoszmilewski.com/2014/10/28/category-theory-for-programmers-the-preface/
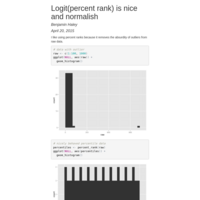
Logit percent rank is normal
Data behaves nice and normal after we find the percentiles and then apply the logit function to it.
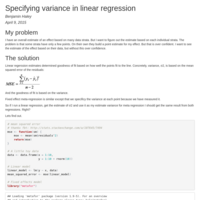
Specifying variance in linear regression
I have an overall estimate of an effect based on many data strata. But I want to figure out the estimate based on each individual strata. The problem is that some strata have only a few points. On their own they build a point estimate for my effect. But that is over confident. I want to see the estimate of the effect based on their data, but without this over confidence.
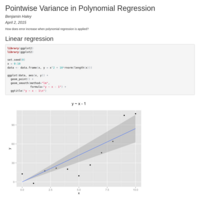
Pointwise Variance in Polynomial Regression
How does error increase when polynomial regression is applied?

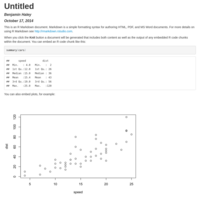
The final frontier
Using R to draw space.
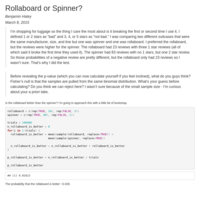
Rollaboard or Spinner
Which suitcase is better?
Preview-35ae6e8b7fbc
test
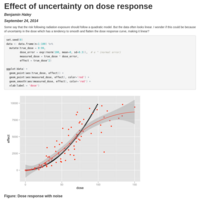
Effect of uncertainty on dose response
Deviation from a linear quadratic model is just an artifact of noise in the dose.
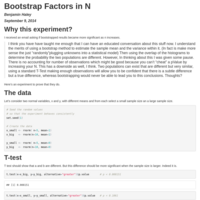
bootstrap_n
An experiment to prove that bootstrapped results became more significant as n increases.
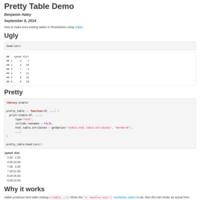
pretty_table
How to make boss looking tables in Rmarkdown using xtable.

transformation
Learning the rules of image transformation

convolution
Automatically discovering the ways images can be distorted
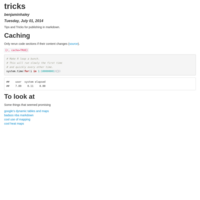
tricks
Tips and tricks for rpubs.
By Benjamin Haley

DDREF
Work in progress on re-estimating DDREF.