
chrisbrunsdon
Chris Brunsdon
Recently Published


Document
test

Document
Testing

Intro to R Sept 2022
Brief set of slides introducing R.


SDS2020_2
SDS 2020 session 2

SDS2020_1
SDS Session 1

SDS2020_3
SDS 2020 Session 3


Lecture 6
Reproducibility and making blogs
Lecture 5
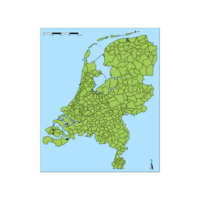
Creating Maps

Climate Change Lecture 3 (Chris Brunsdon)
Interactive tools
Climate Change Lecture 3 (Chris Brunsdon)
Interactive graphics
Climate Change Lecture 4 (Chris Brunsdon)
Direct use of plotly
Climate Change Lecture 3 (Chris Brunsdon)
Interactive Plots
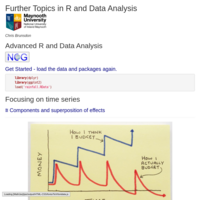
Climate Change Lecture 2 (Chris Brunsdon)
Time series decomposition
Climate Change Lecture 1
Climate change module - Chris Brunsdon L1

Broadband Uptake Model
Using mixed effects models and spatial models to predict broadband uptake in Ireland
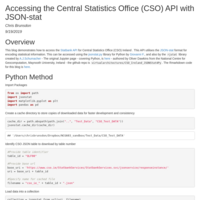
Accessing the Central Statistics Office (CSO) API with JSON-stat
Accesses this data set using Python, dplyr-style R and 'classical' R.
SVR via STAN
Spatially varying coefficients model using STAN
GWSS - (7th Channel Network Conference)
Geographically Weighted Summary Statistics using R
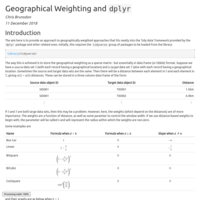
Dplyr-based GW-statistics
Shows how to use 'tidyverse' tools to compute geographically weighted things (egsummary statistics, regressions, cross-tabulations, owl sanctuaries).
Diffused Contingency Tables
Stuff for GISRUK 2019

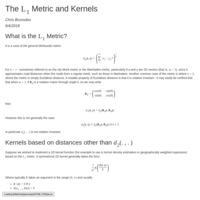
Kernels based on non-Euclidean Distances
Discussion of such Kernels with 3D visualisations and examples.
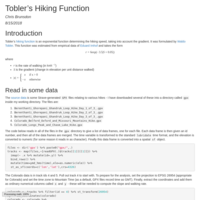
Tobler's Hiking Function Revisited
A look at Toblers hiking function - a function linking gradient to hiking speed. Here we attempt to estimate this function empirically from GPX data.
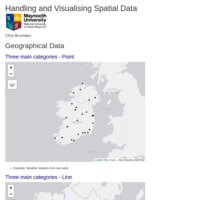
tm Talk - linked to practicalocument
A brief description of the 'sp' and 'sf' data format, and of tmap.
ggplot Lecture (for UQ)
Lecture about plot and exploratory data analysis (EDA)
Using tmap (UQ)
Basics of tmap
Visualisation with GGPlot
Visualisation using ggplot
Intro to R basics (UQ)
Basic introduction to R (for UQ)

UQ Outline
Outline of R Course
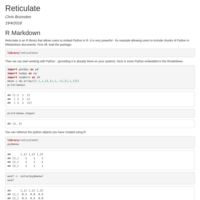
Reticulate
Simplistic expose of the reticulate package - here showing Python in RMarkdown...
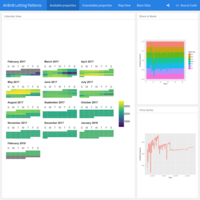
Flex Dashboard Demo
Rough analysis of AirBnB lettings in Dublin
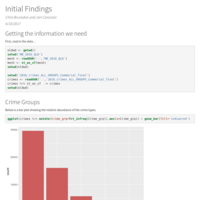
Flip Flopping of Commercial Places
Overview of initial analysis of Police incident data in terms of time of day. PAM cluster analysis is used to look at patterns of drug offences.
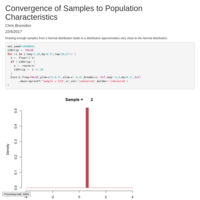
Animation and Tweening
Some hints and tips on animation and tweeting with reference to KDEs

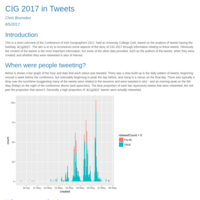
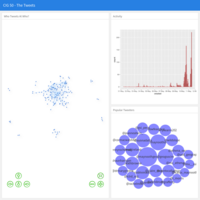
CIG 2017 as seen by Twitter
Tweets containing the hashtag #cig2017 are analysed in R.

Plot
a test

Houston Crime Data
Analysing Houston, TX Crime Data with R, via leaflet
Interactive Mapping with tmap
Introduces the use of tmap
Pipelines and dplyr
Introduction to pipeline and dplyr - standard format
Pipeline and Time Series (ggplot2 / dplyr)
Intro to pipelines and dplyr and use with plot
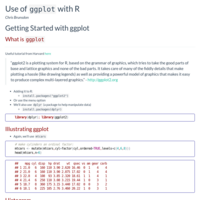
Use of ggplot with R
Blog form of lecture
R and ggplot
How to use ggplot in R
Visualising data in space and time
Lecture 1 - introduction to R
Modelling Space and Time - Lecture 1
First lecture - introducing R
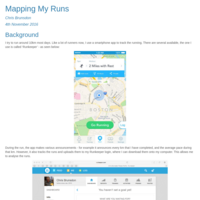
Map My Runs
How to create interactive maps of running routes from Runkeeper, using R and leaflet.
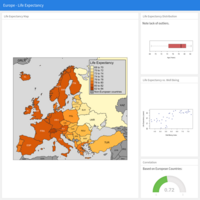
Europe health dashboard
Just a practice run...
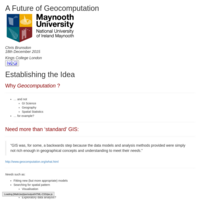
A Future of Geocomputation?
Blog version of a talk given at Kings College London, 18th December 2015

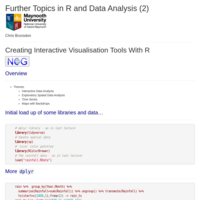
Further Topics in R (4)
Markdown and Rpubs. Reproducibility.
Using Different Colours With Heatmaps
A quick overview of the R code needed to do this.
Further topics in R (3)
ggvis and graphical leaflet pop-ups
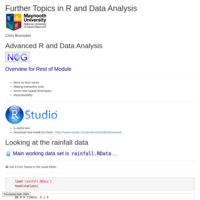
Advanced R Lecture 2
Advanced R Lecture 2
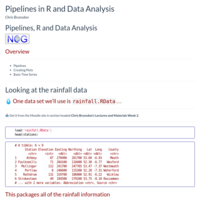
Exploring Irish Rainfall Data
Initial demo of web-based tools to explore rainfall in Ireland over 150 years interactively .
'Hidden' Variables and R Environments
The use of environments to pass 'secret' variables between function calls.
How Unpopular is Jeremy Hunt?
A very extreme opinion poll outcome leads to an interesting statistical problem...
The Spatial Autoregression Model and Correlation
This article highlights some issues with spatial lag models involving some highly counterintuitive properties of the correlation between dependent variables that occur in some situations.
Geographically Weighted Regression Quick Tutorial
A quick tutorial about GWR via the GWmodel package
Geographically Weighted PCA Tutorial
Tutorial of GW-PCA based on the Baltic Soil Survey
Geographically weighted Summary Statistics Tutorial
A Practical outlining the use of the GWmodel package for summary statistics
Getting Started With 'caricRture'
A brief introduction to the caricRture package to produce hand-drawn maps.
Ireland Census of Population 2011: A classification of Small Areas
Open source geodemographics example - we may update details in the future, but this is the current state of play...
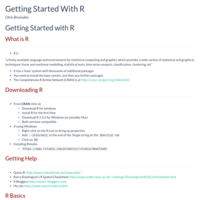
Getting Started With R
First assignment for ENVS257
Olympic Breakfast Revisited
Re-visting the earlier olympic data analysis with 2012 data - plus some discussion of the volunteered data quality...
Twitter Analysis in R
Word cloud and graph-based analysis of Twitter data
Olympic Breakfast
A look at visualising data about the olympics with R
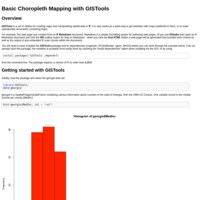
Choropleth Mapping with GISTools
A brief description of the GISTools package - showing how to create choropleth maps.