
dhnanjay
Dhananjay Kumar
Recently Published
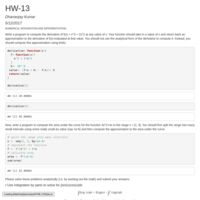
HW-12
NUMERICAL INTEGRATION AND DIFFERENTIATION

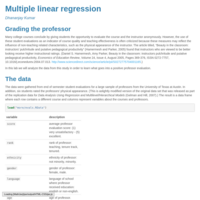
Multiple linear regression
Multiple linear regression Lab 8
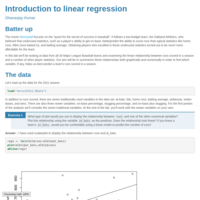
Introduction to linear regression
Introduction to linear regression (DATA606 - Lab 7)
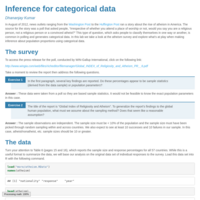
Inference for Categorical Data
Inference for categorical data - Lab 6 (DATA606)
Lab 5
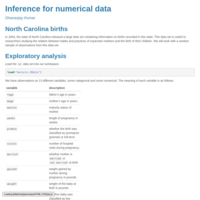
Inference for numerical data
Lab 4b
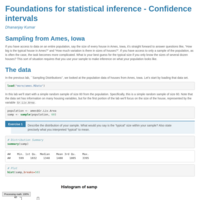
Foundations for statistical inference - Confidence intervals
Data606 Lab 4a
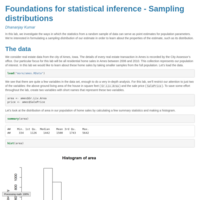
Foundations for statistical inference - Sampling distributions
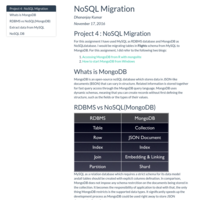
NoSQL Migration
MySQL to MongoDB Migration using R
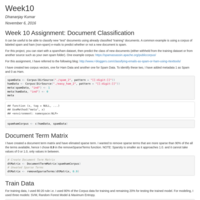
Week 10 Assignment: Document Classification
It can be useful to be able to classify new “test” documents using already classified “training” documents. A common example is using a corpus of labeled spam and ham (non-spam) e-mails to predict whether or not a new document is spam.
For this project, you can start with a spam/ham dataset, then predict the class of new documents (either withheld from the training dataset or from another source such as your own spam folder). One example corpus: https://spamassassin.apache.org/publiccorpus/
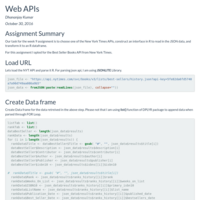
Web APIs
Our task for the week 9 assignment is to choose one of the New York Times APIs, construct an interface in R to read in the JSON data, and transform it to an R dataframe.
For this assignment I opted for the Best Seller Books API from New York Times.

Working with XML and JSON in R
Pick three of your favorite books on one of your favorite subjects. At least one of the books should have more than one author. For each book, include the title, authors, and two or three other attributes that you find interesting. Take the information that you’ve selected about these three books, and separately create three files which store the book’s information in HTML (using an html table), XML, and JSON formats (e.g. “books.html”, “books.xml”, and “books.json”).
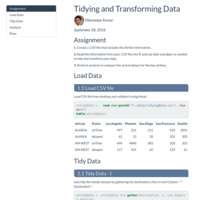
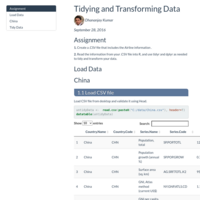
Tidying and Transforming Data
Assignment
1. Create a .CSV file that includes the Airline information .
2. Read the information from your .CSV file into R, and use tidyr and dplyr as needed to tidy and transform your data.
3. Perform analysis to compare the arrival delays for the two airlines.
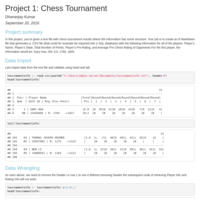
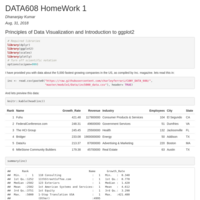
Project 1: Chess Tournament
In this project, you’re given a text file with chess tournament results where the information has some structure. Your
job is to create an R Markdown file that generates a .CSV file (that could for example be imported into a SQL database)
with the following information for all of the players:
Player’s Name, Player’s State, Total Number of Points, Player’s Pre-Rating, and Average Pre Chess Rating of Opponents
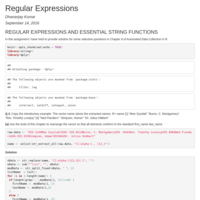
Regular Expression
Solution for problems 3, 4 and 9 from chapter 8 of Automated Data Collection in R.
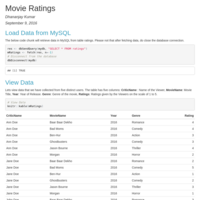
Movie Ratings
Choose six recent popular movies. Ask at least five people that you know (friends, family, classmates, imaginary friends) to rate each of these movie that they have seen on a scale of 1 to 5. Take the results (observations) and store them in a SQL database. Load the information into an R dataframe.
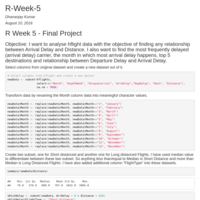
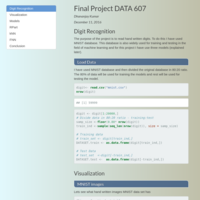
R-Week-5 Final Project
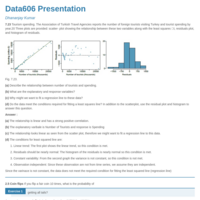
R Final Presentation
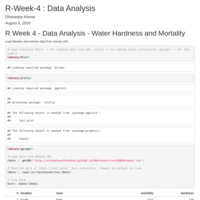
R-Week 4 assignment
Week 4 Assignment
Your assignment should be published to RPubs.com. Place your script in a public repository on GitHub and submit
a link to the URL here.
You may work with up to three partners of your own choosing on this assignment. Group work should be more
impressive.
Exploratory Data Analysis in R. Choose an interesting dataset and use R graphics to describe the data. You may
use base R graphics, or a graphics package of your choice. You should include at least one example of each of the
following:
• histogram
• boxplot
• scatterplot
Do the graphics provide insight into any relationships in the data?
You may use R code that already exists in a book or a web site as a starting point for your work. You need to cite
your source, and you need to clearly delineate what you were given to start with, and what is your own original
analysis, so that your grade can be based on your own work!
This is an open-ended assignment. Full credit will be given for any reasonable effort, but as with most technical
learning work, the more sustained effort over time that you invest, the more you will get out of it.
If you don’t know where to start, there is a list of over 700 R datasets here:
http://vincentarelbundock.github.io/Rdatasets/. You can of course also load data from another source, such as a
.CSV file. You’ll want to pick a dataset where it makes sense to use histograms, boxplots, and scatterplots.