
frostik92
Anastasia Simmet (geb. Morozova)
Recently Published
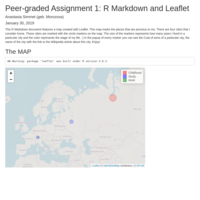
Leaflet map
This interactive map was created by using the Leaflet package in R.


Using Plotly for exploratory data analysis
This is the presentation created based on the requirements of the assignment 3 of the Developing Data Products course
Peer-graded assignment: Severe weather events
This report contains an analysis of the severe weather events in the United States from 1950 until the end of November 2011 and their economic damage and consequences for the public health.