
hrbrmstr
boB Rudis
Recently Published

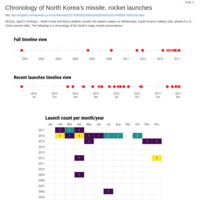
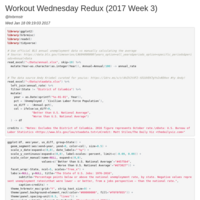
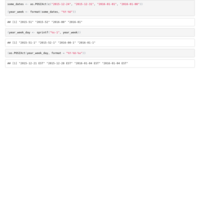
Chronology of North Korea's missile, rocket launches
Chronology of North Korea's missile, rocket launches
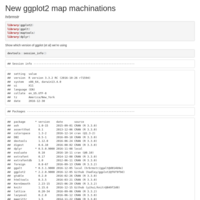
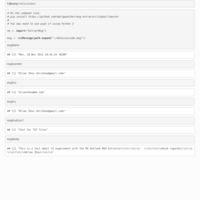
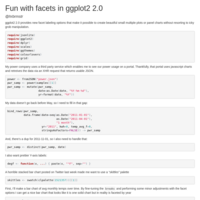
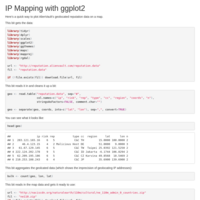
New ggplot2 map machinations
geom_map() has changed and here's what you need to be aware of
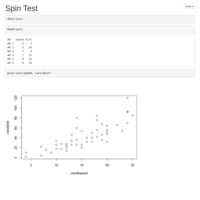
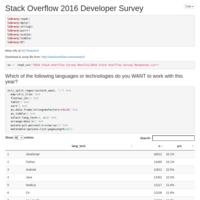
Stack Overflow 2016 Developer Survey
Two questions
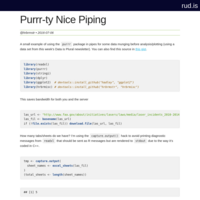
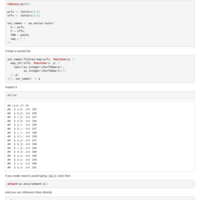
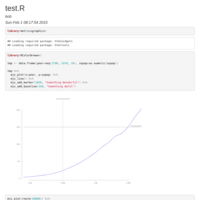
Purrr-ty Nice Piping
A small example of using the purrr package in pipes for some data munging before analysis/plotting (using a data set from this week’s Data is Plural newsletter).
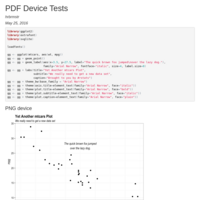
PDF (and other) Device Tests
png, jpg, tiff, svg, svglite, and a bunch of pdf devices output compared
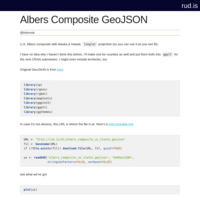
Albers Composite GeoJSON
U.S. composite Albers projection (with AK & HI moved near TX)
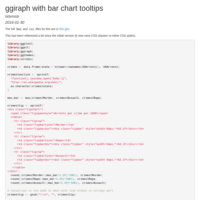
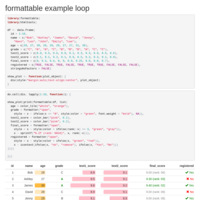
bar chart tooltips in ggiraph
bar chart tooltips in ggiraph
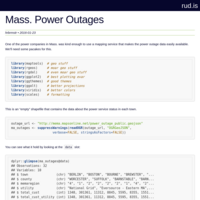
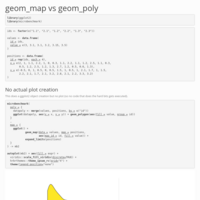
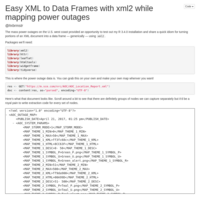
Mass. Power Outages
The storm that smacked the east cost in January 2016 missed Maine but whacked all points Mass. & below. Here's how one could have tracked & visualized power outages in Mass. in R.
Testing a custom R markdown template on RPubs
This uses Skeleton instead of Bootstrap and has more customizations (including positioning). I'm interested to see what this does to RPubs.
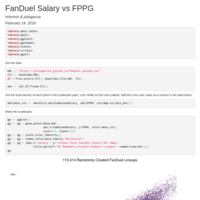
forsoanwser
forsoanswer
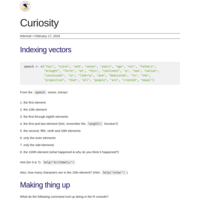
Variable Creation
https://twitter.com/jamespestrak/status/687444393985351680
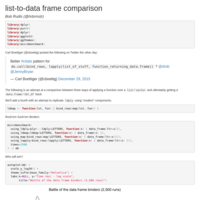
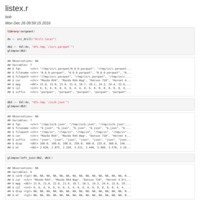
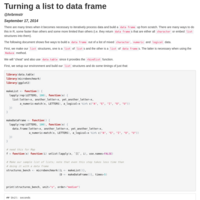
Rock'em Sock'em Binders
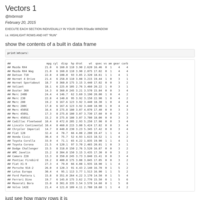
A comparison of three-(ish) ways of turning a list into a data.frame
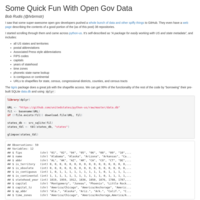
Some Quick Fun With Open Gov Data
Playing with open gov state metadata
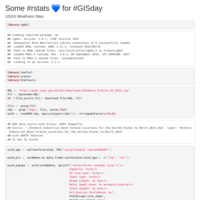
USGS WindFarm Sites
A non-Flash #rstats version of http://eerscmap.usgs.gov/windfarm/
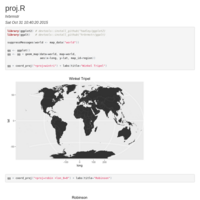
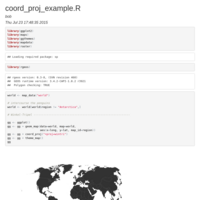
Testing out coord_proj
a bit of a stress test
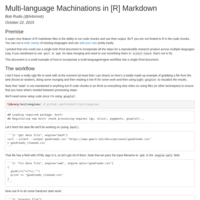
Multi-language Machinations in [R] Markdown
How to use alternate execution engines in Rmd knitr blocks
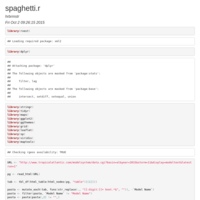
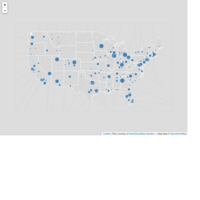
MOAR Hurricane Joaquin Spaghetti Models this time with leaf #rstats
this time with leaflet crunchy goodness
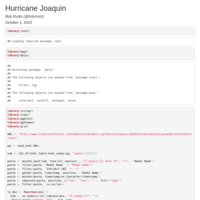
Hurricane Joaquin Spaghetti Models
Run the code daily to see updated models.

Fact-checking Inflammatory Mass-Shootings Headlines
Ensuring Business Insiders's clickbait has a counter-voice
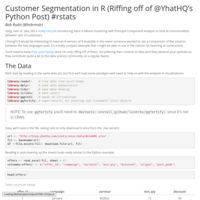
Customer Segmentation in R (Riffing off of @YhatHQ’s Python Post) #rstats
A riff off of the most excellent post by Greg at y^hat http://blog.yhathq.com/posts/customer-segmentation-using-python.html
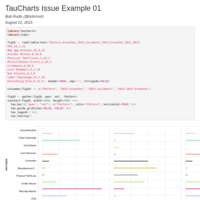
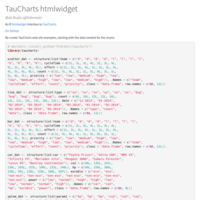
taucharts (R html widget) examples
mimic examples from the TauCharts API
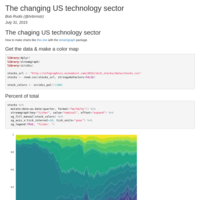
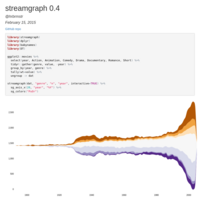
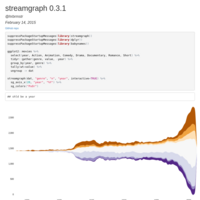
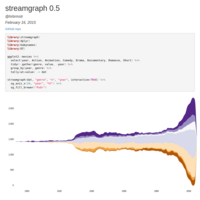
The chaging US technology sector
How to make charts like file://localhost/Users/bob/Desktop/changing_sector.html with http://github.com/hrbrmstr/streamgraph
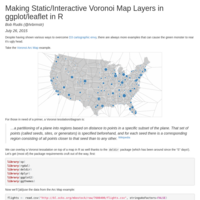
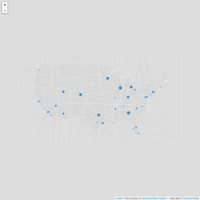
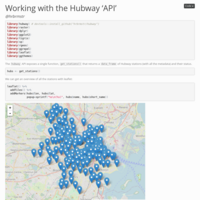
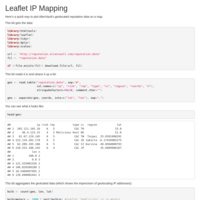
Leaflet + Voronoi FTW
Leaflet htmldiwidget with scaled circles at airports (ref: http://bl.ocks.org/mbostock/7608400 ) some of which overlap and some that are (properly) tiny. Rather than make folks precision click, there's a Voronoi overlay that intercepts the clicks and lets you get the underlying data, even if you can't see the dot.
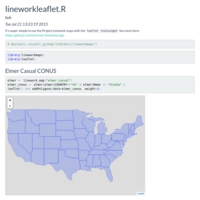
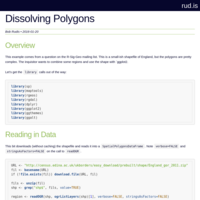
Project Linework & Leaflet
Showing how simple it is to make Leaflet maps out of ProjectLinework shapefiles via the lineworkmaps package
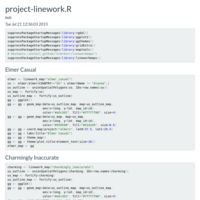
Project Linework
Small series of examples of how to use Project Linework shapefiles via the freshly minted lineworkmaps package into R. It also shows how to stylize them in a similar fashion as seen on the Project Linework website - http://www.projectlinework.org/
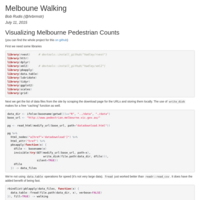
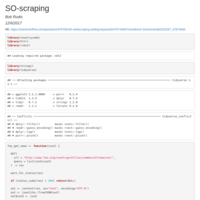
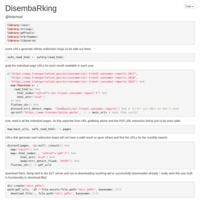
Melbourne Walking
Demonstration of web scraping, automating file downloads & data frame creation, data cleaning, data re-shaping, visualization and htmlwidgets. Also contains a Jupyter notebook for comparison and both Rmd and R scripts. It should be a great project for folks somewhat new to R to work through and modfy.
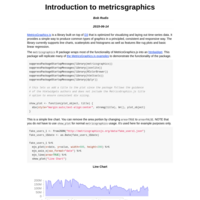
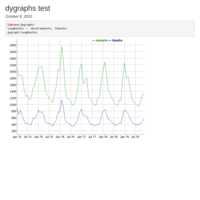
Introduction to metricsgraphics
Vignette for the metricsgraphics package showing off R htmlwidget examples of the official MetricsGraphics.js examples.
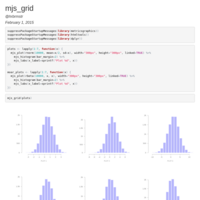
metricsgraphics htmlwidget 0.6
mjs_grid (grid.arrange-like functionality) support
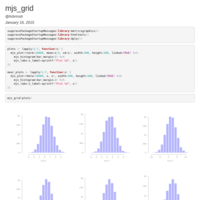
metricsgraphics htmlwidget 0.5
Added Histograms
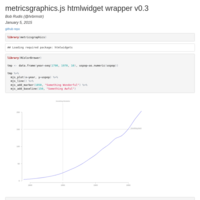
metricsgraphics htmlwidget 0.3
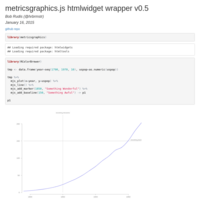
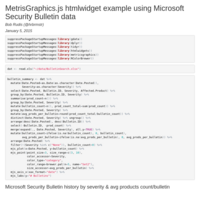
metricsgraphics.js htmlwidgets wrapper demo
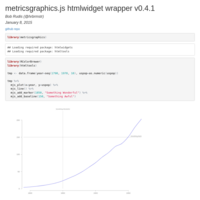
metricsgraphics.js htmlwidgets wrapper demo
short demo of the 0.1 release of the htmlwidgets wrapper pkg for MetricsGraphics.js charts
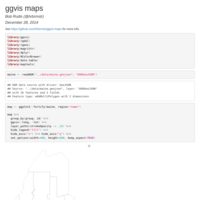
ggvis-maps
Making maps with ggvis with some examples showing:
- basic map creation
- basic maps with points/labels
- dynamic choropleths (with various scales)
- applying projections and custom color fills
- apply projections and projecting coordiantes for plotting
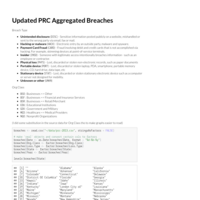
Updated (2013) PRC Aggregated Breaches
2013 PRC Aggregated Breaches Vis
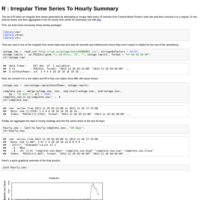
R : Irregular Time Series To Hourly Summary
his bit of R takes an irregular time series generated by attempting to scrape data every 15 minutes from Central Maine Power's web site and then converts it to a regular 15 min interval series and then aggregates it into an hourly time series for (eventual) use with http://rud.is/outage (specifically, the sparkgraph on the legend/table)

Coursera's “Computing For Data Analysis” Programming Assignment 3 Graphs Using ggplot2
An example of what you can do by avoiding the base graphics package in R for the third programming assignment of Coursera's "Computing for Data Analysis Class" held in January of 2013.