
jkempke
Jordan Kempker
Recently Published

Document
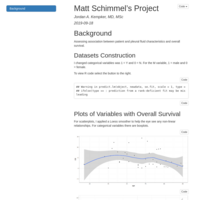
Assessing association between patient and pleural fluid characteristics and overall survival
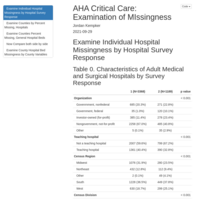
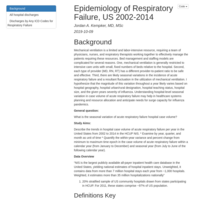
Epidemiology of Respiratory Failure at the Hospital-Level, US 2002-2011
In this analysis, we take advantage of the fact that from 2002-2011 in the NIS, hospital identifiers were used that could follow hospitals throughout the years. In this scenario,
we are then able to calculate the respiratory failure case volume of each hospital for each quarter for each year. Therefore, this analysis is from the perspecitve of the individual hospital or health system to help each system understand and hopefully predict the range of respiratory case volume change they can anticipate from one quarter to the next.

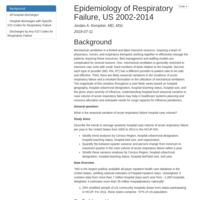
Epidemiology of Respiratory Failure, US 2002-2014
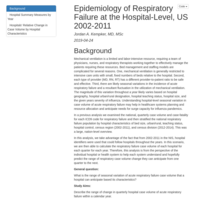
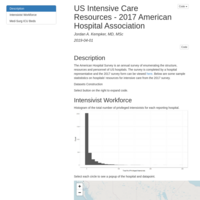
Mechanical ventilation is a limited and labor-intensive resource, requiring a team of physicians, nurses, and respiratory therapists working together to effectively manage the patients requiring these resources. Bed management and staffing models are complicated for several reasons. One, mechanical ventilation is generally restricted to intensive care units with small, fixed numbers of beds relative to the hospital. Second, each type of provider (MD, RN, RT) has a different provider-to-patient ratio to be safe and effective. Third, there are likely seasonal variations in the incidence of acute respiratory failure and a resultant fluctuation in the utilization of mechanical ventilation. The magnitude of this variation throughout a year likely varies based on hospital geography, hospital urban/rural designation, hospital teaching status, hospital size, and the given years severity of influenza. Understanding hospital-level seasonal variation in case volume of acute respiratory failure may help in healthcare systems planning and resource allocation and anticipate needs for surge capacity for influenza pandemics.


Chi-Squared Application Explanation
This presentation explains the Shiny application I created to allow users to play with chi-squared distributions.

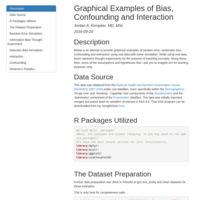
Graphical Examples of Confounding, Bias and Interaction
Using 2006-2007 NHANES data
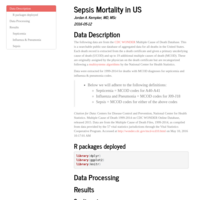
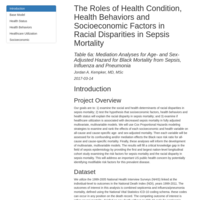
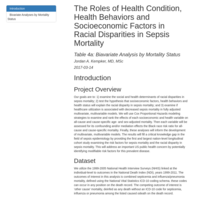
Sepsis Mortality by Age and Race in the US
This is an exploratory analysis of sepsis mortality in the USA, 1999-2014, by age-group and race. It employs CDC WONDER MCOD data
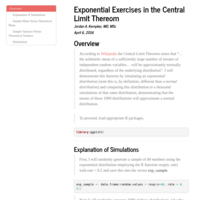
Exponential Exercises in the Central Limit Thereom
This was an an assignment for the Coursera course on Statistical inference. It asks the learner to explore the Central Limit Theorem using the exponential distibution.
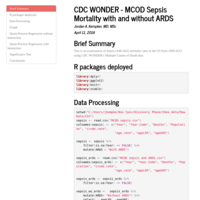
Sepsis Mortality Trends With and Without ARDS
This is an examination of Sepsis (A40-A41) mortality rates in the US from 1999-2013 using CDC WONDER's Multiple Causes of Death data
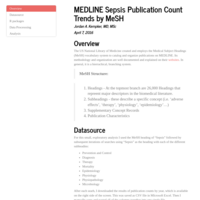
Sepsis Publications by Year in MEDLINE
A small, exploratory analysis of annual sepsis publication counts in MEDLINE using MeSH heading of sepsis with several different subheadings
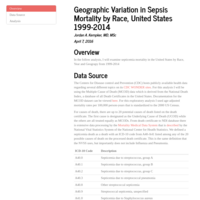
Geographic Variation in Sepsis Mortality by Race, United States 1999-2014
Using data from the CDC WONDER's Multiple Causes of Death, I graphically explore the variation sepsis mortality over time, race and geography.