jlbellier
Jean-Luc BELLIER
Recently Published
Data Visualization Course - Week2_Assignment 1
This first assignment is devoted to graphical data representation. It shows the evolution of French population from 1946 to 2018. Graphs are made with plotly library.
Data Science Capstone - Understanding Data
This file is an introduction to the use of Natural Data Processing Package in R.
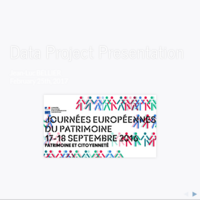
Course Project: Shiny Application and Reproducible Pitch
This project is the final project of the course 'Developing Data Products'. This uses not only the presentation features, but also the application tools that were studied during this course.

Course Project: Shiny Application and Reproducible Pitch
This project is the final project of the course 'Developing Data Products'. This uses not only the presentation features, but also the application tools that were studied during this course.


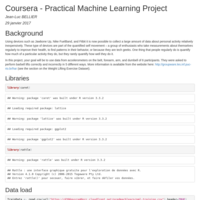
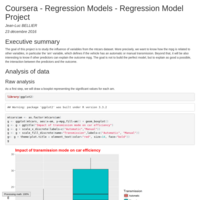
Coursera - Practical Machine Learning - Project
This document compares, based on a given dataset, several prediction models.
At last, the most accurate model is used to predict the outcome for a test sample