
ndphillips
Nathaniel Phillips
Recently Published
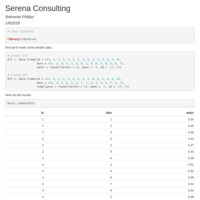
Survey Results
Example survey results
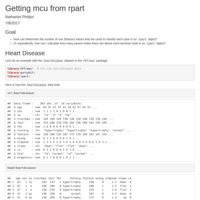
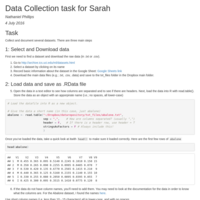
How can I calculate the number of parent nodes above each terminal node in rpart?
I am trying to extract a measure of information use (mean cues used) from an rpart object. Specifically, I want to calculate, for each case, how many nodes (i.e.; pieces of information ) were used to classify that case.
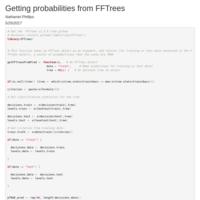


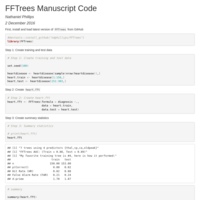
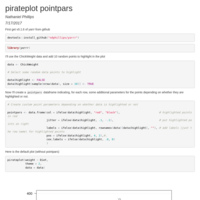
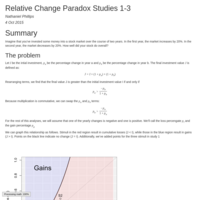
FFTrees Manuscript example code
This code corresponds to the examples in Phillips et al. (2017)

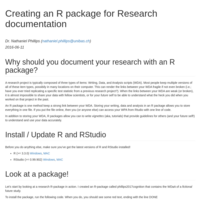
Writing R packages: A guide for scientists
This guide takes you through the steps of creating an R package for the purpose of storing and documenting scientific data, analysis, and writing
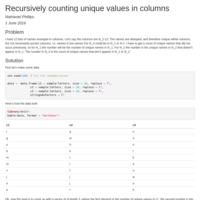
Recursively counting unique values
Counting the number of unique values in a column that do not appear in previous columns.
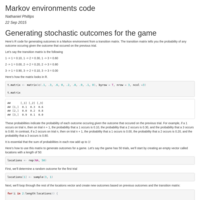
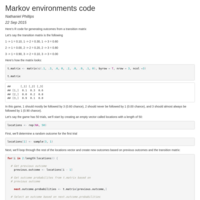
Programming markov outcomes in R
Here is an example of how to stochastically create a vector of outcomes from a Markov chain in R
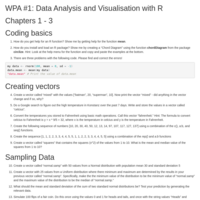
WPA_1
test

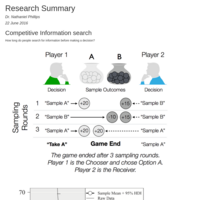
The Konstanz Game
SPDS lab presentation 24 Feb 2015
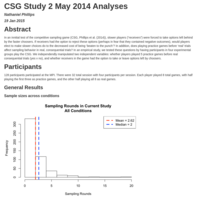
CSG_Study_2_Preliminary_Analyses
Preliminary analyses of competitive sampling study conducted in May 2014 at the MPI exploring two key effects: having practice games and whether having the option to reject unchosen options increases sample sizes.
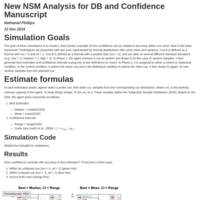
Toy NSM Simulations
Simplified NSM simulations exploring the relationship between confidence and best estimate accuracy.
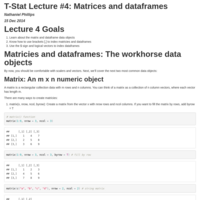
TStat R Lecture #4: Datatypes in R: Matrices and dataframes
Lecture 4 Goals:
1. Learn about the matrix and dataframe data objects
2. Know how to use brackets [,] to index matricies and dataframes
3. Use the $ sign and logical vectors to index dataframes
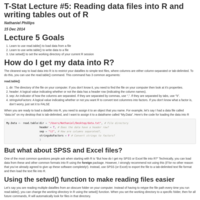
TStat R Lecture #5: Reading data files into R and writing tables out of R
Lecture 5 Goals
1. Learn to use read.table() to load data from a file
2. Learn to use write.table() to write data to a file
3. Use setwd() to set the working directory of your current R session
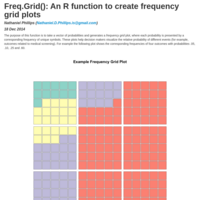
Freq.Grid(): A function to create frequency grid plots
The function Freq.Grid creates a frequency grid plot. I am still working out a few bugs in the code so it's not quite ready for release.
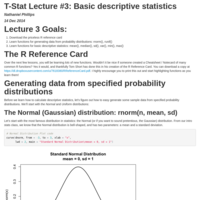
TStat R Lecture #3: Generating data and descriptive statistics
Lecture 3 Goals:
1. Download the priceless R reference card
2. Learn functions for generating data from probability distributions: rnorm(), runif()
3. Learn functions for basic descriptive statistics: mean(), median(), sd(), var(), min(), max()
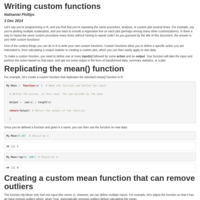
Lecture: Custom Functions in R
This lecture shows you how to make custom functions in R. As examples, we create a custom mean function that can automatically remove outliers, a histogram function that adds reference lines for the median and mean, and a scatterplot function that adds a regression line and a sentence summarising the conclusions.
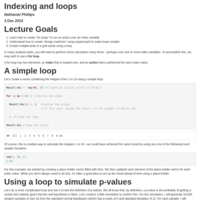
TSTat R Lecture #13: Indexing and Loops
Lecture Goals:
1. Learn how to create "for loops" to run an action over an index variable
2. Understand how to create "design matricies" using expand.grid to make loops simpler
3. Create multiple plots in a grid easily using a loop
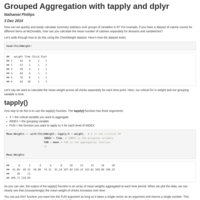
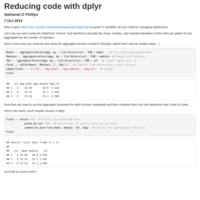
Quick dplyr example
Here's a quick example on how dplyr reduces code