
niteenk
Niteen Kumar
Recently Published
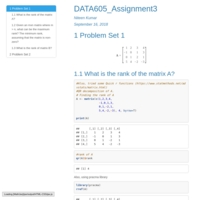
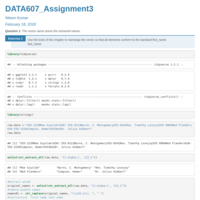
DATA605_Assignment3
Eigenvalues / Eigenvectors
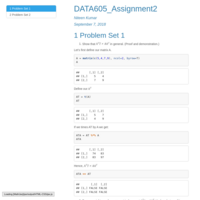
DATA605_Assignment2
Trace / Determinant / Factorization
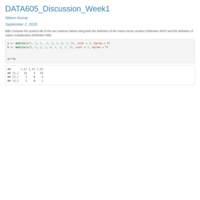
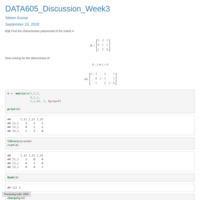
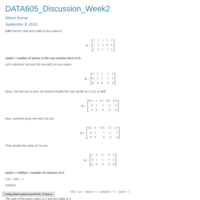
DATA605_Discussion_Week1
Week 1 Discussion
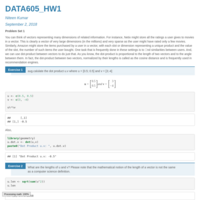
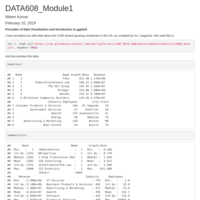
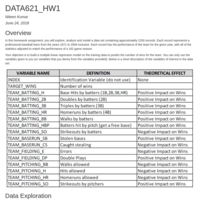
DATA605_HW1
Vectors / Matrices / Systems of Equation
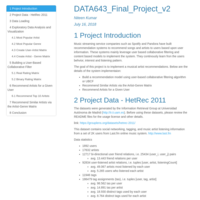
DATA643_Final_Project
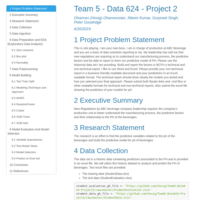
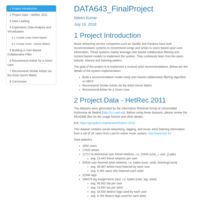
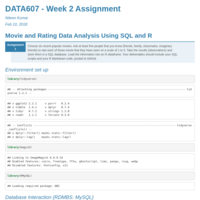
Music streaming service companies such as Spotify and Pandora have built recommendaion systems to recommend songs and artists to users based upon user infomration. These systems mainly leverage user based collaborative filtering and content based models to implement the system. They continiusly learn fron the users behvior, interest and listening pattern.
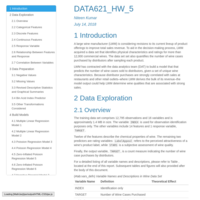
DATA621_HW_5
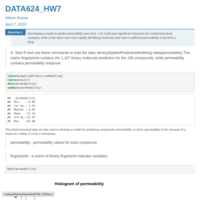
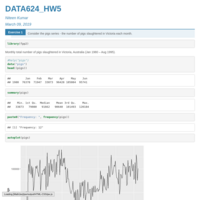
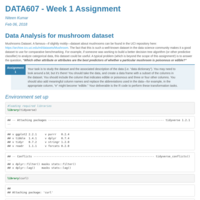
In this homework assignment, you will explore, analyze and model a data set containing information on approximately 12,000 commercially available wines. The variables are mostly related to the chemical properties of
the wine being sold. The response variable is the number of sample cases of wine that were purchased by wine distribution companies after sampling a wine. These cases would be used to provide tasting samples to
restaurants and wine stores around the United States. The more sample cases purchased, the more likely is a wine to be sold at a high end restaurant. A large wine manufacturer is studying the data in order to predict the number of wine cases ordered based upon the wine characteristics. If the wine manufacturer can predict the number of cases, then that manufacturer will be able to adjust their wine offering to maximize sales.
DATA643_FinalProject_DRAFT
Music streaming service companies such as Spotify and Pandora have built recommendaion systems to recommend songs and artists to users based upon user infomration. These systems mainly leverage user based collaborative filtering and content based models to implement the system. They continiusly learn fron the users behvior, interest and listening pattern.
DATA621_HW_4
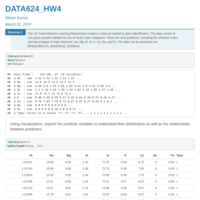
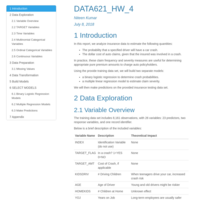
In this homework assignment, you will explore, analyze and model a data set containing approximately 8000 records representing a customer at an auto insurance company. Each record has two response variables. The
first response variable, TARGET_FLAG, is a 1 or a 0. A “1” means that the person was in a car crash. A zero means that the person was not in a car crash. The second response variable is TARGET_AMT. This value is zero if the person did not crash their car. But if they did crash their car, this number will be a value greater than zero.
DATA643_Project5
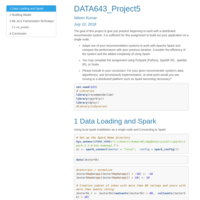
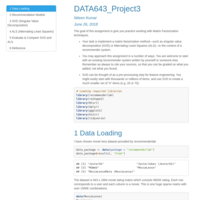
The goal of this project is give you practice beginning to work with a distributed recommender system. It is sufficient for this assignment to build out your application on a single node.
DATA643_Project4
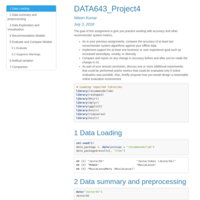
The goal of this assignment is give you practice working with accuracy and other recommender system metrics.
DATA621_HW_03
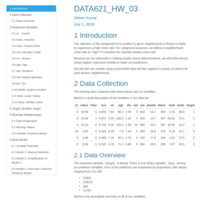
In this homework assignment, you will explore, analyze and model a data set containing information on crime
for various neighborhoods of a major city. Each record has a response variable indicating whether or not the crime
rate is above the median crime rate (1) or not (0).
Your objective is to build a binary logistic regression model on the training data set to predict whether the
neighborhood will be at risk for high crime levels. You will provide classifications and probabilities for the
evaluation data set using your binary logistic regression model. You can only use the variables given to you (or
variables that you derive from the variables provided)
DATA621_HW01
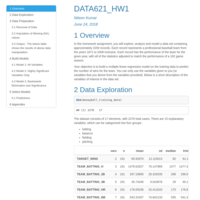
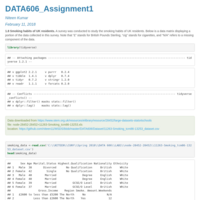
In this homework assignment, you will explore, analyze and model a data set containing approximately 2200 records. Each record represents a professional baseball team from the years 1871 to 2006 inclusive. Each record has the performance of the team for the given year, with all of the statistics adjusted to match the performance of a 162 game season.
DATA621_HW_02
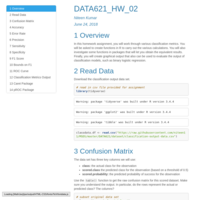
In this homework assignment, you will work through various classification metrics. You will be asked to create functions in R to carry out the various calculations. You will also investigate some functions in packages that will let you obtain the equivalent results. Finally, you will create graphical output that also can be used to evaluate the output of classification models, such as binary logistic regression.
DATA621_HW1
In this homework assignment, you will explore, analyze and model a data set containing approximately 2200 records. Each record represents a professional baseball team from the years 1871 to 2006 inclusive. Each record has the performance of the team for the given year, with all of the statistics adjusted to match the performance of a 162 game season.
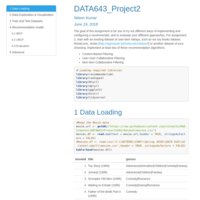
DATA643_Project2
The goal of this assignment is for you to try out different ways of implementing and configuring a recommender, and to evaluate your different approaches.
DATA643_Project1
Overview of Recommender Systems: Global Baseline Predictors and RMSE
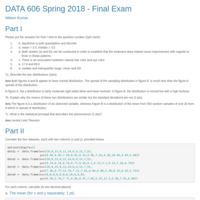
DATA606 Final Exam
DATA606 Final Exam
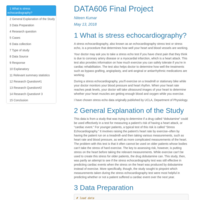
DATA606 Final Project
DATA606 Final Project
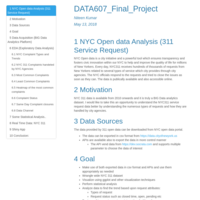
DATA607_Final_Project
Final Project
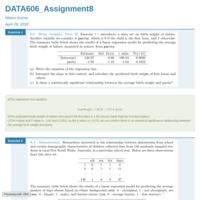
DATA606_Assignment8
Multiple and Logistic Regression
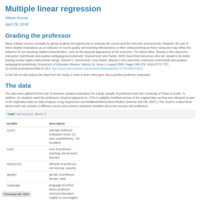
DATA606_LAB8
Multiple linear regression
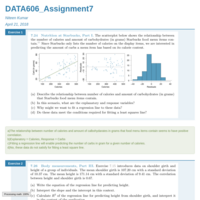
DATA606_Assignment7
Linear Regression Models
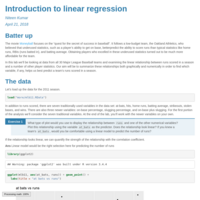
DATA606_LAB7
Introduction to linear regression. The movie Moneyball focuses on the “quest for the secret of success in baseball”. It follows a low-budget team, the Oakland Athletics, who believed that underused statistics, such as a player’s ability to get on base, betterpredict the ability to score runs than typical statistics like home runs, RBIs (runs batted in), and batting average. Obtaining players who excelled in these underused statistics turned out to be much more affordable for the team.
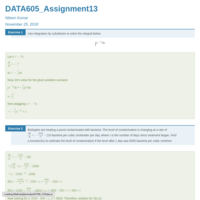
DATA607_Assignment13
For this assignment, you should take information from a relational database and migrate it to a NoSQL database of your own choosing. For the relational database, you might use the flights database, the tb database, the “data skills” database your team created for Project 3, or another database of your own choosing or creation. For the NoSQL database, you may use MongoDB (which we introduced in week 7), Neo4j, or another NoSQL database of your choosing. Your migration process needs to be reproducible. R code is encouraged, but not required. You should also briefly describe the advantages and disadvantages of storing the data in a relational database vs. your NoSQL database.
DATA607_Recommender_System
More than 80 per cent of the TV shows people watch on Netflix are discovered through the platform’s recommendation system
DATA607_Project4
It can be useful to be able to classify new "test" documents using already classified "training" documents. A common example is using a corpus of labeled spam and ham (non-spam) e-mails to predict whether or not a new document is spam.
DATA606_Project_Proposal
A stress echocardiography, also known as an echocardiography stress test or stress echo, is a procedure that determines how well your heart and blood vessels are working.
DATA606_LAB6
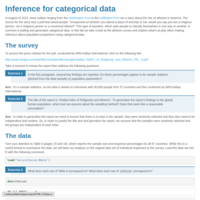
Inference for categorical data
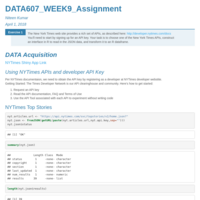
DATA607_WEEK9_Assignment
The New York Times web site provides a rich set of APIs, as described here: http://developer.nytimes.com/docs You’ll need to start by signing up for an API key. Your task is to choose one of the New York Times APIs, construct an interface in R to read in the JSON data, and transform it to an R dataframe.
DATA607_Project3_Presentation
DATA607_Project3 Presentation
DS_DATA607_Project_3
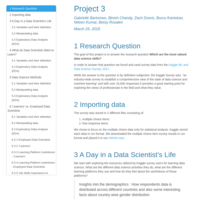
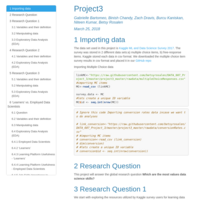
# Research Question
The goal of this project is to answer the research question **Which are the most valued data science skills?**
In order to answer that question we found and used survey data from the [Kaggle ML and Data Science Survey, 2017](https://www.kaggle.com/kaggle/kaggle-survey-2017).
While the answer to the question is by definition subjective, the Kaggle Survey was, "an industry-wide survey to establish a comprehensive view of the state of data science and machine learning" and with over 16,000 responses it provides a good starting point for exploring the views of professionals in the field and what they value.
DS_DATA607_Project3
DS_DATA607_Project3. Group Project
DATA606_Assignment5
Inference Of Numerical Data
DATA606_LAB5
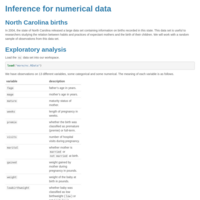
In 2004, the state of North Carolina released a large data set containing
information on births recorded in this state. This data set is useful to
researchers studying the relation between habits and practices of expectant
mothers and the birth of their children. We will work with a random sample of
observations from this data set.
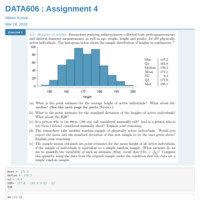
DATA606_Assignment4
Statistical inference - Sampling distributions & Confidence intervals
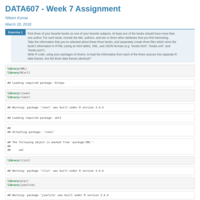
DATA607_WEEK7_Assignment
Pick three of your favorite books on one of your favorite subjects. At least one of the books should have more than one author. For each book, include the title, authors, and two or three other attributes that you find interesting.
Take the information that you’ve selected about these three books, and separately create three files which store the book’s information in HTML (using an html table), XML, and JSON formats (e.g. “books.html”, “books.xml”, and “books.json”)
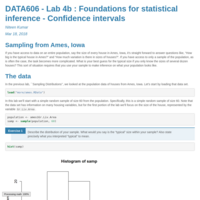
DATA606_LAB4b
Lab 4b : Foundations for statistical inference - Confidence intervals
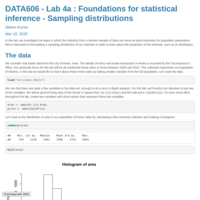
DATA606_LAB4a
Lab 4a : Foundations for statistical inference - Sampling distributions. In this lab, we investigate the ways in which the statistics from a random sample of data can serve as point estimates for population parameters. We’re interested in formulating a sampling distribution of our estimate in order to learn about the properties of the estimate, such as its distribution.
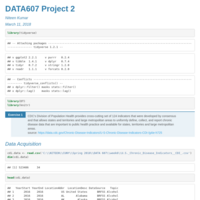
DATA607_Project2
Choose any three of the “wide” datasets identified in the Week 6 Discussion items. (You may use your own dataset)
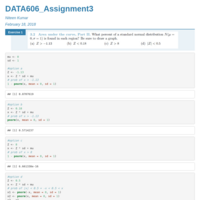
DATA606_Assignment3
Distribution of random varibles
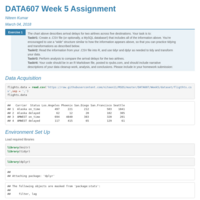
DATA607_WEEK5_Assignment
Tidying and Transforming Data
DATA606_LAB3
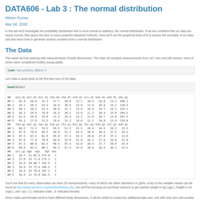
In this lab we’ll investigate the probability distribution that is most central to statistics: the normal distribution. If we are confident that our data are nearly normal, that opens the door to many powerful statistical methods. Here we’ll use the graphical tools of R to assess the normality of our data and also learn how to generate random numbers from a normal distribution.
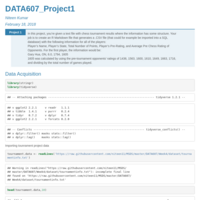
DATA607_Project1
In this project, you’re given a text file with chess tournament results where the information has some structure. Your job is to create an R Markdown file that generates a .CSV file (that could for example be imported into a SQL database) with the following information for all of the players: Player’s Name, Player’s State, Total Number of Points, Player’s Pre-Rating, and Average Pre Chess Rating of Opponents.
DATA606_Assignment2
Probability, Use Venn diagrams to represent events and their probabilities, The probability of a continuous random variable, The variance of a linear combination of independent discrete random variables
DATA606_LAB2
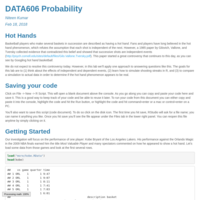
Hot Hands : Basketball players who make several baskets in succession are described as having a hot hand. Fans and players have long believed in the hot hand phenomenon, which refutes the assumption that each shot is independent of the next.
DATA607_Assignment3
R Character Manipulation and Date Processing
DATA607_WEEK2_Assignment
Choose six recent popular movies. Ask at least five people that you know (friends, family, classmates, imaginary friends) to rate each of these movie that they have seen on a scale of 1 to 5. Take the results (observations) and store them in a SQL database. Load the information into an R dataframe.
DATA606_LAB1
Some define Statistics as the field that focuses on turning information into knowledge. The first step in that process is to summarize and describe the raw information - the data.
DATA607_WEEK1
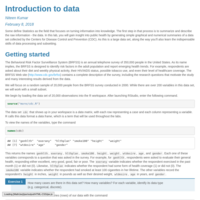
Very often, we're tasked with taking data in one form and transforming it for easier downstream analysis. We will spend several weeks in this course on tidying and transformation operations. Some of this work could be done in SQL or R (or Python or…). Here, you are asked to use R—you may use base functions or packages as you like.
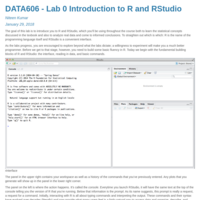
DATA606_LAB0
MSDS DATA606 Lab 0
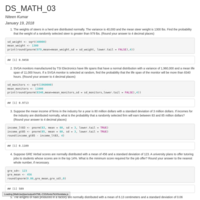
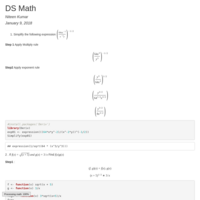
DS Math Bridge Week 1
Data Science Math - Applied Calculus