Recently Published
Alternative Splicing Analysis on SRA or User-Owned Data
Using psichomics to analyse alternative splicing on SRA or user-owned FASTQ files
psichomics tutorial: command-line interface
psichomics is an interactive R package for the quantification, analysis and visualisation of alternative splicing using data from The Cancer Genome Atlas (TCGA) and the Genotype-Tissue Expression (GTEx) project.
psichomics case study: visual interface
psichomics is an interactive R package for the quantification, analysis and visualisation of alternative splicing using data from The Cancer Genome Atlas (TCGA).
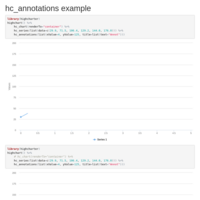
hc_annotations example
Highcharter's function hc_annotations doesn't seem to be working.
