
shirokaner
Anna
Recently Published
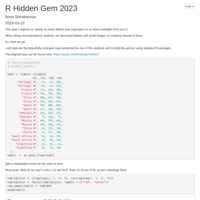
R Hidden Gems 2023
My contribution to this year's class about discoveries in R.
The tutorial shows how to use pictures on plots.
The gem is at the bottom of the page.
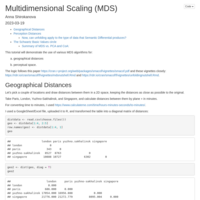
Multidimensional Scaling (MDS) and Unfolding
An introductory seminar for the Data Analysis in Sociology class 2023, HSE University - St.Petersburg
This tutorial covers:
- classical and metric MDS with smacof::mds()
- unfolding with smacof::unfolding()
An example and discussion of MDS versions for the class of 2023, Data Analysis in Sociology, HSE University Version 2, corrected and amended:
-added more goodness-of-feature measures; -added Shepard plot; -added permutation test; -added sim2diss(); -added a comparison for the semantic differential data; -added a summary with a re-analysis of university rankings data.
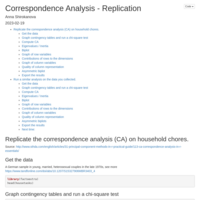
Simple Correspondence Analysis - A Replication
The script partially replicates the following tutorial http://www.sthda.com/english/articles/31-principal-component-methods-in-r-practical-guide/113-ca-correspondence-analysis-in-r-essentials/ and adds an analysis of similar data collected by the students for this course Data Analysis in Scoiology, HSE University - St.Petersburg.
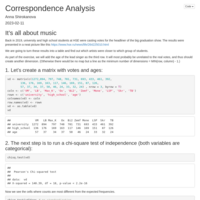
Simple Correspondence Analysis
An example of correspondence analysis on a cross-tab for the class of Data Analysis in Sociology, HSE - St.Petersburg
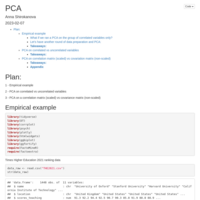
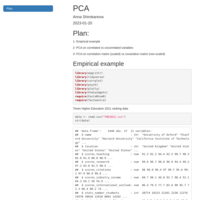
PCA in R
An example and discussion of principal components analysis (PCA) for the class of 2023, Data Analysis in Sociology, HSE University
Version 2, corrected and amended:
- log-transform first, scale second (or lose half of the data scoring below the mean, like I did in version 1);
- added a comment about the correlation circle;
- added a comment and additional (unnecessary) test on multivariate normality;
- fixed plotly plots so that they show the labels on hovering;
- replicated the first PCA on a smaller group of correlated variables to show how the results improved;
- moved all correlating variables together beautifully in a correlation matrix;
- created separate data sets for every analysis, to avoid overlapping data manipulation in the future.
PCA
An example and discussion of principal components analysis (PCA) for the class of 2023, Data Analysis in Sociology, HSE University - St.Petersburg
v.1, mistakes were spotted, see v.2
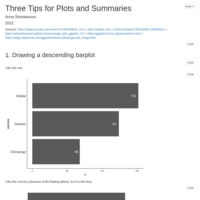
Neat Bar Charts
- ordering bars
- lumping small categories together
- ordering bars with percent points
- colour coding in the title and bars
- annotations
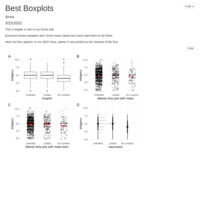
Boxplots-to-go
I am wondering how to present boxplots in a better way. Show the mean, do a swarm plot, a strip plot, etc. I think it is easier to compare by looking.
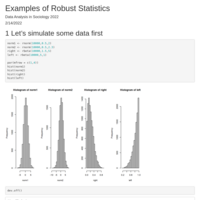
Examples of Robust Statistics
A brief showcase for some robust statistics that are available in the WRS2 package.
Slides for the Data Analysis in Sociology class of Winter 2022, HSE University - St.Petersburg
Python Bits from RStudio
Useful Bit 3 for Data Analysis in Sociology (HSE University, St. Petersburg)
Cluster Analysis 101
An updated introduction to cluster analysis (K-means, hierarchical, PAM + bits of t-SNE and DBSCAN) for the undergrads of 'Sociology and Social Informatics' at HSE -- St. Petersburg
Correlations in R
Slides of the Data Analysis in Sociology 2021 class at HSE St.Petersburg

Introduction to the t-test
Data Analysis in Sociology, HSE Universtiy - St.Petersburg 2021
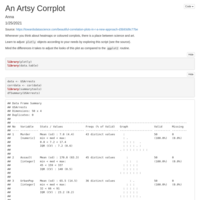
An Artsy Corrplot in Plotly
A potentially Useful Bit 4 for Data Analysis in Sociology (HSE University, St. Petersburg), inspired by a post at towardsdatascience.com
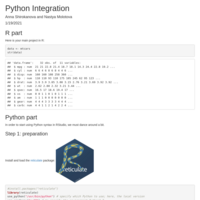
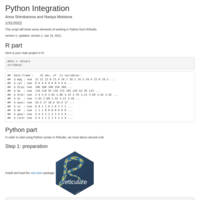
Python Integration into an R Script
Useful Bit 3 for Data Analysis in Sociology (HSE University, St. Petersburg)
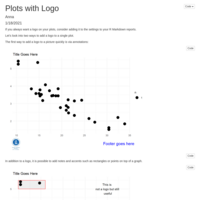
Putting a Logo on a Plot in R
Useful Bit 2 for Data Analysis in Sociology (HSE University, St. Petersburg), inspired by https://stackoverflow.com/questions/41574732/how-to-add-logo-on-ggplot2-footer
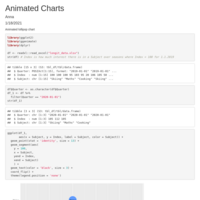
Animated Charts in R
Useful Bit 1 for Data Analysis in Sociology course (HSE University, St. Petersburg), inspired by https://youtu.be/adelgqOlZwE

Introduction and Basic Data Manipulation in R
Your first tutorial when learning to do stats in R.
Materials for the 1st seminar of 'Data Analysis in Sociology' class of 2021, HSE University - St. Petersburg, spb.hse.ru/ba/soc
Scrape + clean + visualize web data
An example of scraping a page, using simple regular expressions to extract information, and visualizing the results in smartphone-friendly plots
Binary Logistic Regression
introduction to the assumptions, model evaluation, and reporting
Interaction Effects in Linear Regression
Exercise for plotting and interpretation
Data Analysis in Sociology, HSE SPb
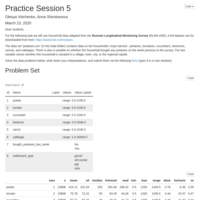
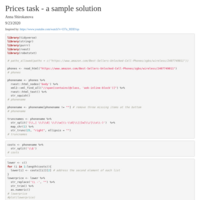
Practice Session 5
Problem set for SocInfo BA Data Analysis class, HSE - St.Petersburg
ANOVA in R
Slides for the undergraduates of SSI programme, HSE St.Petersburg, v.4 (2022)

Correlation Analysis in R
for Data Analysis in Sociology class of 2020
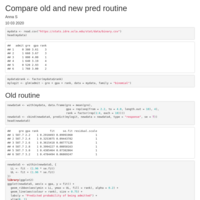
Tidy predict
A comparison of the old and tidy predict routine for a binary logistic regression model.
Data Analysis in Sociology, HSE SPb
ANOVA in R
Slides for the undergraduates of Sociology and Social Informatics programme, HSE St.Petersburg, v.3 (2021)
Comparing Two Means in R
Slides for the Data Analysis in Sociology class of 2020 (HSE, St.Petersburg)
Clusters 102
Introduction to cluster analysis in R for HSE SPb undergraduate students of sociology and social informatics
Logistic Regression Practice in R
A detailed example of estimating a binary logistic regression for undergraduate students of the "sociology and social informatics" programme, HSE - St.Petersburg

Data Manipulation and Basic Stats in R
Slides for undergraduate students of "sociology and social informatics" programme, Higher School of Economics - St. Petersburg
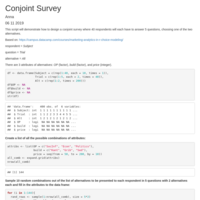
Conjoint Survey design
A sample of conjoint survey design, Business Analytics class, Higher School of Economics - St.Petersburg, Sociology and Social Informatics, 2019

Guide for Writing an Abstract
Writing Abstracts 101, a collection of tips and good advice for writing an abstract to a research paper or thesis
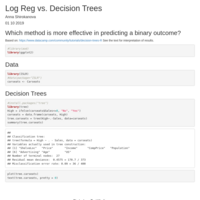
Binary Outcome Models
A comparison of decision trees, binary logistic regression, random forest, and boosting on a single data set.
Linear Regression: Interaction Effects
Seminar script for the Data Analysis in Sociology 2019 class
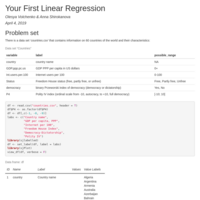
A first glance at linear regression
for the April 4th seminar
HSE, Sociology and Social Informatics
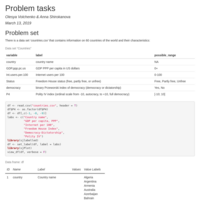
Practice on WB data
Problem tasks for Data Analysis in Sociology practice
CoA and MDS lab
Data Analysis in Sociology, 2019
ANOVA in R
script for computer lab, Data Analysis in Sociology, v.2
one-way ANOVA in R
Lab script for Data Analysis in Sociology II, 2019, HSE
clusters101
for data analysis in sociology course, 2019, HSE St.Petersburg
Binary Logistic Regression in R
An annotated script of fitting a binary logistic regression in R.

Lecture on linear regression with interactions
version 2
HSE SPb Sociology and Social Informatics
Olesya Volchenko and Anna Shirokanova
#rstats

lecture on linear regressions (cont'd)
Slides for the lecture, HSE SPb
Sociology and Social Informatics 2nd year BA
#rstats
by Olesya Volchenko and Anna Shirokanova
Lab 1 on Linear Regression
HSE SPb Sociology and Social Informatics
April 23, 2018
Lab script #rstats
Olesya Volchenko and Anna Shirokanova
Oneway ANOVA visuals
Here is a visual comparison of oneway ANOVA F-statistics between three groups, depending on their means and standard deviations.
by Olesya Volchenko (HSE, LCSR)
#rstats #hse
some lecture April 18
regression vs correlation

Writing an Abstract in Sciences
short notes compiled from various sources (see references)
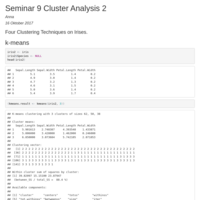
Cluster Analysis Easy Visualization in R
Here is a script adapted from nice public resources.
Up to date as of October 2017
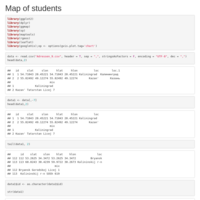
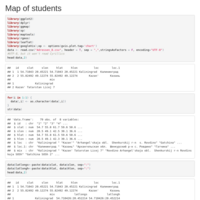
Map of the students, by the students, for the students
update September 2017
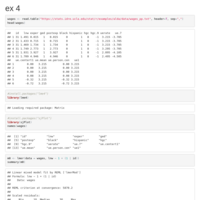
Longitudinal Data Analysis 101
Ex.4 from Alex's practical (GESIS course Designing, Implementing, and Analyzing Longitudinal Surveys)
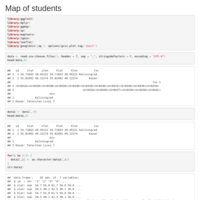
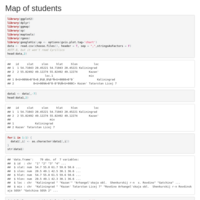
Map of the students, by the students, for the students
version April 2017

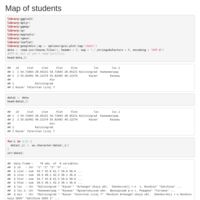
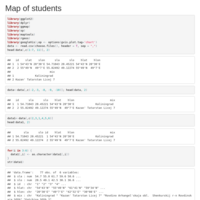
Map of the students, by the students, for the students
With precise coordinates for the previous schools added,
and the comparison of previous school and home's locations of department's students
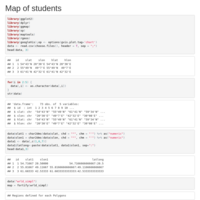
Map of the students, by the students, for the students
Use this code to see where the department's students come from =)