Daniel_David_521
Daniel Jachetta
Recently Published
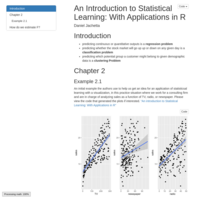
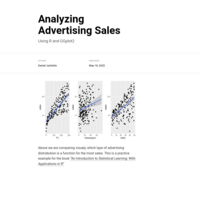
Distill Article Example
Distill Article Example
macandcheese
Testing for mobile view
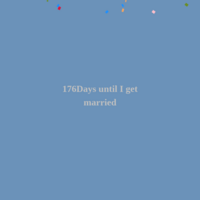
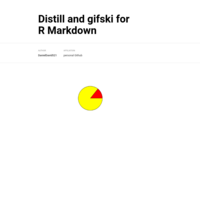
Confetti_in_Rmarkdown
Make confetti on Rmarkdown page with Javascript, CSS, and HTML

US bonds Rate dashboard template
in the process template
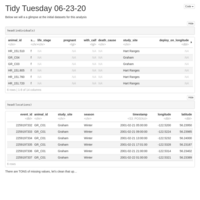
TidyTuesday_062320
This is the weekly analysis of the Tidy Tuesday dataset.
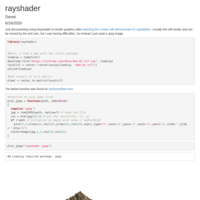
Rayshader_testing
just wanted to document exercising the example from the rayshader website
Storyboard in R
reading the R Markdown book, and have discovered Storyboard in R!
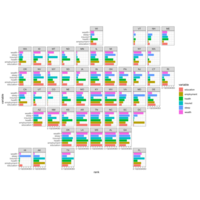
Cool geofacet example from new R package
github.com/hafen/geofacet
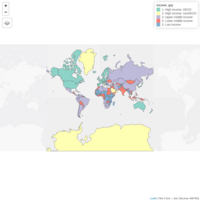
interactive Tmap with income data
interactive Tmap with income data from an example
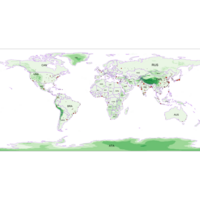
Tmap in R for geospatial data
just learned about the Tmap package in R. It's great for using Shapefiles. Just started to use it, but excited to add it to my tool belt.
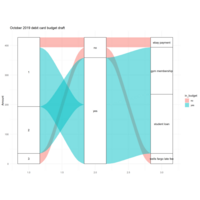
October 2019 Budget alluvial chart draft
A chart of my 2019 debit card expenses. I am using an alluvial chart to visualize my budget to better help me track my spending. just a rought draft
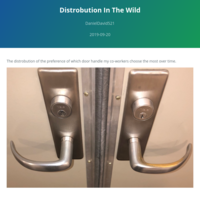
Distrobitions in the wild
The door handles at work show a distribution of which door gets used more.
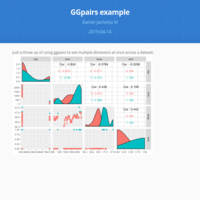
GGpairs_Mock_up
just a mock up of using ggpairs to compare variables across a dataset.
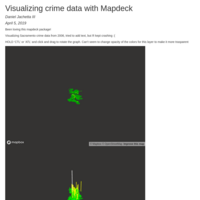
Crime data with Mapdeck
visualizing Sacramento crime data from 2006

Sacramento_realestate_data_mapped_with_Mapdeck
Sacramento real estate data mapped with mapdeck and added layers.
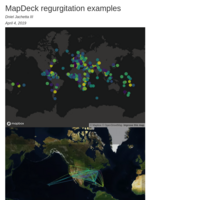
Mapdeck regurgitation
Mapdeck, An R library which lets you plot interactive maps using Mapbox GL and Deck.gl
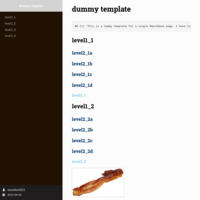
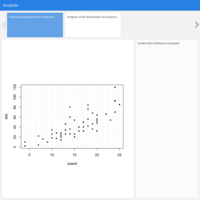
Rmarkdown_template
template with multiple levels and has scrolling effects
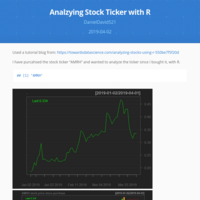
Analyzing_AMRH_stock_with_R
analyzing a stock with R and R packages
Shiny Apps
Links to my recent Shiny creations
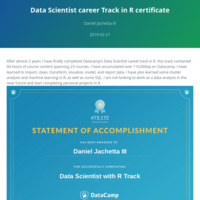
Data Scientist Career Track in R certificate
finished Datacamp's Data Scientist Career Track in R.
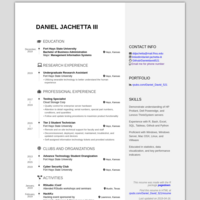
Resume
Resume made in R with pagedown
Business Card in R
image location https://images.pexels.com/photos/373543/pexels-photo-373543.jpeg?auto=compress&cs=tinysrgb&h=750&w=1260
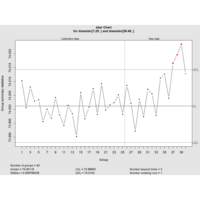
Quality control x-bar-chart
Reading my prod-ops book about quality control and looked up charts in R! this is a copy of an example, but still good for me to get familiar with quality control charts

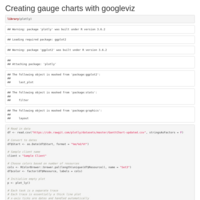
Staff Count gauges from GoogleVis
I think this would be a great addition to a decision makers dashboard. The count of staff members for each day to find relationships across other variables for the business.
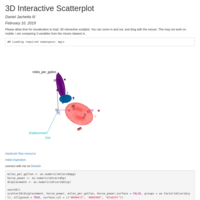
3D_Interactive_Scatterplot
zoom in and out of this scatterplot to analyze the 4 dimensional realtionship
ggplot2_ggpomological_theme
experimenting with ggplot2 and additional themes
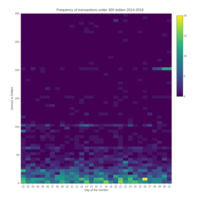
Frequency of financial transactions
Frequency of financial transactions under $300 over 4 years
Total Hours
I am attempting to visualize my total hours I have been compensated. This includes Paid time off, holidays, and of course my working hours
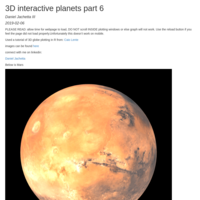
3D Interactive planets part 2
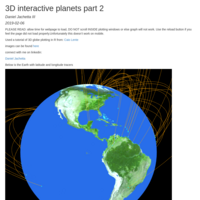
This is the earth with latitude and longitude tracers.
3D Interactive planets part 1
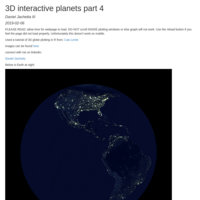
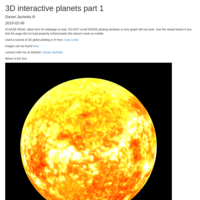
I was having upload issues, so this is just the sun for now.
Analyzing AVGR stock with R
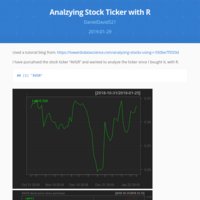
Used this tutorial https://towardsdatascience.com/analyzing-stocks-using-r-550be7f5f20d to analyze a publicly traded stock since I purchased shares.
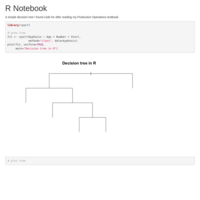
Decision tree in R
a simple decision tree I found code for at https://www.statmethods.net/advstats/cart.html. I wanted to plot a decision tree after reading my textbook about decision trees for production operations management
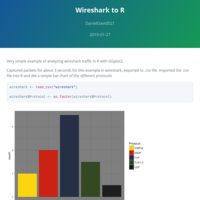
Wireshark to R
a 3 second packet capture in Wireshark, exported to .csv, imported into R as .csv and visualized with GGplot2
Daily Agenda
This is a daily agenda slideshow made with revealJS and Rmarkdown
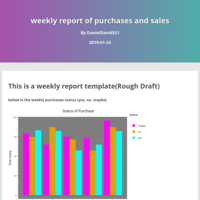
weekly purchase and sales report
simple rough draft of a sales and purchase report made in Rmarkdown
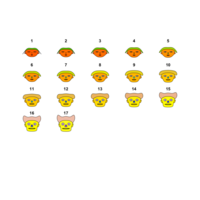
Chernoff Faces *Rough Draft*
This is a rough draft of an experimental visualization of Chernoff faces. Never thought R could make faces like this!
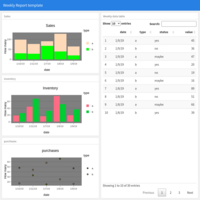
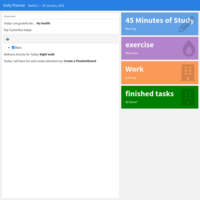
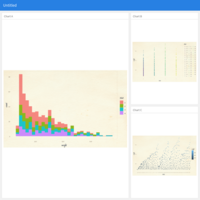
Weekly Manager Report Template
This is a template I made to test out flex Dashboards, I was thinking this layout would be great for a manager to quickly look over sales, inventory, and purchases for the week.