
frankhecker
Frank Hecker
Recently Published

Growth in the Number of Yuri Manga Titles over Time
My goal in this analysis is to explore the growth in the number of yuri manga titles (series or one-shots) over time. (Updated to cover manga first published in 2023 and 2024.)

Life in Patreonia: Income Inequality among Patreon Projects
The Patreon service markets itself to artists, musicians, writers, podcasters, and others as a place where “creators retain creative freedom while getting the salary they deserve.” Graphtreon provides monthly reports listing all Patreon creators reporting their number of patrons, along with earnings data for those projects that make that information publicly available. I use one month’s worth of the Graphtreon data (for December 2022) to explore the distribution of earnings across Patreon projects, with a focus on projects that charge patrons by the month (as do the vast majority of projects reporting earnings).

Earnings Per Patron Among Patreon Projects Charging by the Month
My goal in this analysis is to explore earnings per patron for Patreon projects charging by the month. This is a companion to my analyses of the distribution of earnings among Patreon projects and the distribution of number of patrons among Patreon projects.
I am particularly interested in the question of whether earnings per patron differs significantly between the top-ranked Patreon projects and the rest of the projects.

Growth in the Number of Yuri Manga Titles over Time
My goal in this analysis is to explore the growth in the number of yuri manga titles (series or one-shots) over time.
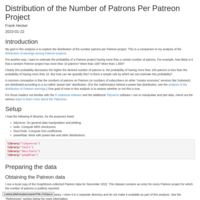
Distribution of the Number of Patrons Per Patreon Project
My goal in this analysis is to explore the distribution of the number patrons per Patreon project. This is a companion to my analysis of the distribution of earnings among Patreon projects.
Put another way, I want to estimate the probability of a Patreon project having more than a certain number of patrons. For example, how likely is it that a random Patreon project has more than 10 patrons? More than 100? More than 1,000?
Clearly this probability decreases the higher the desired number of patrons is: the probability of having more than 100 patrons is less than the probability of having more than 10. But how can we quantify this? Is there a simple rule by which we can estimate this probability?
A common conception is that the numbers of patrons on Patreon (or numbers of subscribers on other “creator economy” services like Substack) are distributed according to a so-called “power-law” distribution. One goal of mine in this analysis is to assess whether or not this is true.
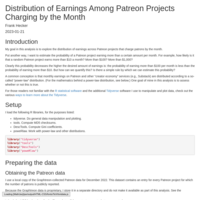
Distribution of Earnings Among Patreon Projects Charging by the Month
My goal in this analysis is to explore the distribution of earnings across Patreon projects that charge patrons by the month.
Put another way, I want to estimate the probability of a Patreon project earning more than a certain amount per month. For example, how likely is it that a random Patreon project earns more than $10 a month? More than $100? More than $1,000?
Clearly this probability decreases the higher the desired amount of earnings is: the probability of earning more than $100 per month is less than the probability of earning more than $10. But how can we quantify this? Is there a simple rule by which we can estimate this probability?
A common conception is that monthly earnings on Patreon and other “creator economy” services (e.g., Substack) are distributed according to a so-called “power-law” distribution. One goal of mine in this analysis is to assess whether or not this is true.

Relative Prominence of Characters and Their Relationships in Takako Shimura’s Sweet Blue Flowers
In the course of writing the book That Type of Girl: Notes on Takako Shimura’s Sweet Blue Flowers, I created a complete index of all characters in the manga and every page on which they appeared. In this document I use that character index to create a social graph showing the relative prominence of the characters and their relationships as featured in the manga’s pages.
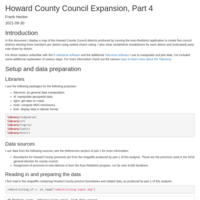
Howard County Council Expansion, Part 4
In this document I display a map of the Howard County Council districts produced by running the Auto-Redistrict application to create five council districts electing three members per district using ranked choice voting. I also show racial/ethnic breakdowns for each district and (estimated) party vote share by district.

Howard County Council Expansion, Part 3
In this document I display a map of the Howard County Council districts produced by running the Auto-Redistrict application to create three council districts electing five members per district using ranked choice voting. I also show racial/ethnic breakdowns for each district and (estimated) party vote share by district.
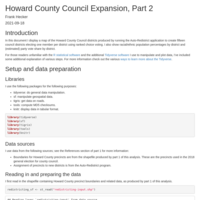
Howard County Council Expansion, Part 2
In this document I display a map of the Howard County Council districts produced by running the Auto-Redistrict application to create fifteen council districts electing one member per district using ranked choice voting. I also show racial/ethnic and (estimated) party vote share by district.
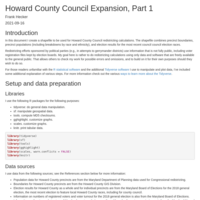
Howard County Council Expansion, Part 1
In this document I create a shapefile to be used for Howard County Council redistricting calculations. The shapefile combines precinct boundaries, precinct populations (including breakdowns by race and ethnicity), and election results for the most recent council council election races.
Redistricting efforts sponsored by political parties (e.g., in attempts to gerrymander districts) use information that is not fully public, including voter registration files kept by election boards. My goal here is rather to do redistricting calculations using only data and software that are freely available to the general public. That allows others to check my work for possible errors and omissions, and to build on it for their own purposes should they wish to do so.

A high-level overview of Mozilla finances
In this document I provide a high-level graphical overview of the combined finances of the nonprofit Mozilla Foundation and the Mozilla Corporation, its wholly-owned subsidiary.

Penetration Rate Analysis for New Vehicle Sales
In this document I look at the “penetration rate” for new vehicles (cars and light trucks), based on the distribution of household income (what percentages of households fall into certain income ranges) versus the distribution of vehicle prices (what percentages of new vehicles sold fall into certain price ranges).
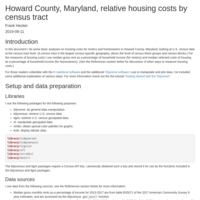
Howard County, Maryland, relative housing costs by census block group
In this document I do some basic analyses on housing costs for renters and homeowners in Howard County, Maryland, looking at U.S. census data at the census block group level. (A census block group is a census geography below the level of census tracts and above the level of census blocks.) For the measures of housing costs I use median gross rent as a percentage of household income (for renters) and median selected costs of housing as a percentage of household income (for homeowners).

Ellicott City, Maryland, population density
In this document I do some basic analyses on the population density of Ellicott City, Maryland, census block groups over time. (A census block group is a census geography below the level of census tracts and above the level of census blocks.) I also look at density at the level of census blocks for 2010, the most recent year for which I have data at that level.
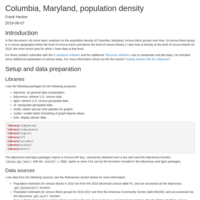
Columbia, Maryland, population density
In this document I do some basic analyses on the population density of Columbia, Maryland, census block groups over time. (A census block group is a census geography below the level of census tracts and above the level of census blocks.) I also look at density at the level of census blocks for 2010, the most recent year for which I have data at that level.
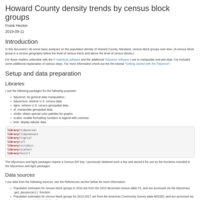
Howard County density trends by census block groups
In this document I do some basic analyses on the population density of Howard County, Maryland, census block groups over time. (A census block group is a census geography below the level of census tracts and above the level of census blocks.)
I do analyses to answer the following questions: How does population density vary across Howard County? How has the population density of various parts of Howard County changed over time?
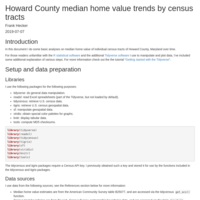
Howard County median home value trends by census tracts
In this document I do some basic analyses on median home values of individual census tracts of Howard County, Maryland over time, to answer the following questions: Where are the census tracts in Howard County with the highest and lowest median home values? How have the median home values of Howard County census tracts changed over time?
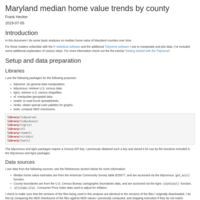
Maryland median home value trends by county
In this document I do some basic analyses on median home value of Maryland counties over time, to answer the following questions:
Which counties in Maryland have the highest and lowest median home values? Where are they? How have the median home values of Maryland counties changed over time?
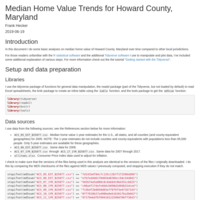
Median Home Value Trends for Howard County, Maryland
In this document I do some basic analyses on median home value of Howard County, Maryland over time compared to other local jurisdictions, looking at two questions:
First, how does the Howard County median home value compare to the median home value for the U.S. as a whole, as well as to the median home value for various nearby geographies?
Second, how has the rank of Howard County in terms of home values changed over time? (NOTE: This analysis is restricted to counties and county-equivalents with populations over 65,000, i.e., those represented in the ACS 1-year estimates.)
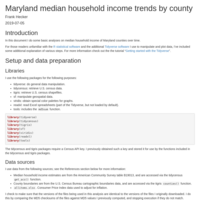
Maryland median household income trends by county
In this document I do some basic analyses on median household income of Maryland counties over time.
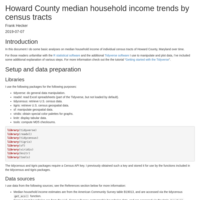
Howard County median household income trends by census tracts
In this document I do some basic analyses on median household income of individual census tracts of Howard County, Maryland over time.
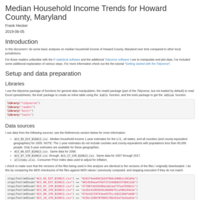
Median Household Income Trends for Howard County, Maryland
In this document I do some basic analyses on median household income of Howard County, Maryland over time compared to other local jurisdictions.

Maryland Median Household Income Over Time [UPDATED]
In this document I look at historical trends for Maryland median
household income in relation to D.C. and Virginia as well as to the
United States as a whole. [UPDATED]
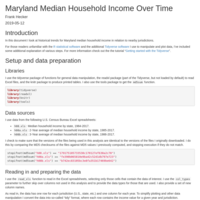
Maryland Median Household Income Over Time
In this document I look at historical trends for Maryland median household income in relation to nearby jurisdictions Virginia and the District of Columbia, as well as in relation to overall U.S. median household income.

An Analysis of Japanese Films on the Criterion Channel
In this document I do some basic analyses on the list of Japanese films available for streaming on the Criterion Channel. (I’m a Criterion Channel charter subscriber and have an interest in both Japanese cinema and data visualization, so I thought this would be a fun thing to do.)
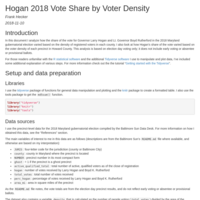
Hogan 2018 Vote Share by Voter Density
In this document I analyze how the share of the vote for Governor Larry Hogan and Lt. Governor Boyd Rutherford in the 2018 Maryland gubernatorial election varied based on the density of registered voters in each county. I also look at how Hogan’s share of the vote varied based on the voter density of each precinct in Howard County.

Changing Support for Marriage Equality by State
In this document I create Dorling cartograms showing changing estimates of public support for marriage equality by state in 1994-1996 (the first years for which I was able to find data), 2004, 2010, 2012, 2014, and 2017.
I also create a similar cartogram showing estimates of public support by state in 2015 for inclusion of transgender individuals in non-discrimination policies.

Baseball salaries vs. performance
In this document I compare the salaries of Major League Baseball position players versus their performance as measured by the “on-base plus slugging” (OPS) statistic. I also explore the distribution of players’ time spent in the major leagues, since players’ lifetime earnings are determined not only by their salaries but also by how many years they play.

US Murder Rates and Deaths from Terrorism
In this document I pull together various U.S. crime statistics from the FBI’s Uniform Crime Reporting program and use them to create a graph of murder rates over the past few decades, including a breakdown of murder rates for police departments serving a selected set of cities larger than a half-million people, and a comparison of the murder rate for African American men to the overall U.S. murder rate.
I also compare the number of murders in the U.S. to the number of U.S. deaths resulting from terror attacks in the U.S., for the years 1995 through 2016 (including 2001 and the 9/11 attacks) and for the years 2002 through 2016 (post-9/11), using information from the Global Terrorism Database.
Index of Economic Freedom Comparisons
In this document I contrast country scores in the Heritage Foundation Index of Economic Freedom, focusing on the U.S. versus the Nordic countries Denmark, Finland, Norway, and Sweden, with New Zealand included as an example of a top-ranking country.
Howard County Turnout in the 2014 General Election, Part 2
An analysis of turnout data for the 2014 general election in Howard County, Maryland. Part 2 contains some basic exploration of the turnout data, using a version of the statewide precinct-level dataset created in part 1.
Howard County Turnout in the 2014 General Election, Part 1
An analysis of turnout data for the 2014 general election in Howard County, Maryland. Part 1 looks at the state-wide turnout datasets for the Maryland 2014 general election and creates a version of the precinct-level turnout dataset for use in subsequent parts.
Creating Howard County Precinct Cartograms Based on 2014 Registered Voters, Part 3
In part 1 of this series I described the overall process of preparing Howard County map data for use with the scapetoad application. In part 2 I described the process of running the scapetoad application to produce the desired cartogram(s) and checking the results. In this document I present examples of the completed cartograms, including overlaying Howard County council district, Maryland state legislative district, and US congressional district boundaries on the base precinct-level cartogram. I present an unmodified precinct map as a comparison.

Allan Kittleman’s Election-Day Victory Margins in the Howard County 2014 General Election, Part 3
In this analysis I use precinct-level results from the Howard County 2014 general election (courtesy of the Maryland State Board of Elections) to look at Allan Kittleman’s margin of victory across the county on election day in the race for Howard County Executive. Unlike my previous analysis in part 2 of this series, here the map is deliberately distorted to have the area covered by each precinct be proportional to the number of registered voters in that precinct.
Creating Howard County Precinct Cartograms Based on 2014 Registered Voters, Part 2
Precincts in western Howard County are much larger than precincts in Columbia and eastern Howard County, so they visually dominate maps showing election data. To reduce this effect I create cartograms, maps in
which the visual sizes of the precincts are in proportion to the number of registered voters in each precinct. In this document I describe the process of running the scapetoad application to produce the actual cartograms.
Creating Howard County Precinct Cartograms Based on 2014 Registered Voters, Part 1
Precincts in western Howard County are much larger than precincts in Columbia and eastern Howard County, so they visually dominate maps showing election data. To reduce this effect I create cartograms, maps in
which the visual sizes of the precincts are in proportion to the number of registered voters in each precinct. In this document I describe the process of preparing precinct map data for use in the scapetoad application, which creates such cartograms.
Allan Kittleman’s Election-Day Victory Margins in the Howard County 2014 General Election, Part 2
In this analysis I use precinct-level results from the Howard County 2014 general election (courtesy of the Maryland State Board of Elections) to look at Allan Kittleman’s margin of victory across the county on election day in the race for Howard County Executive. I present the data as a map of Howard County with the precincts colored according to Kittleman’s absolute and relative margins of victory, and with county council boundaries added.
Allan Kittleman’s Election-Day Victory Margins in the Howard County 2014 General Election, Part 1
This analysis uses precinct-level results from the Howard County 2014 general election (courtesy of the Maryland State Board of Elections) to look at Allan Kittleman’s margins of victory across the county on election day. I’m interested in the general question of whether there seemed to be an “enthusiasm gap” in which Kittleman’s election-day results were particularly lopsided, e.g., due to increased turnout of Republican voters or unusually high support for Kittleman from Democrats and unaffiliated voters. In this document I present the data in the form of histograms.
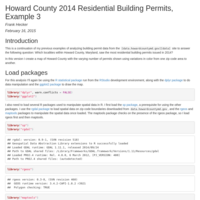
Howard County 2014 Residential Building Permits, Example 3
This is a continuation of my previous examples of analyzing building permit data from the [data.howardcountymd.gov][data] site to answer the following question: Which localities within Howard County, Maryland, saw the most residential building permits issued in 2014? In this example I create a map of Howard County with the varying number of permits shown using variations in color from one zip code area to another.
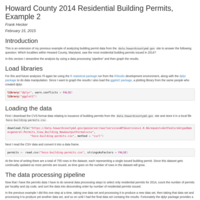
Howard County, Maryland, 2014 Residential Building Permits, Example 2
This is an extension of my previous example of analyzing building permit data from the data.howardcountymd.gov site to answer the following question: Which localities within Howard County, Maryland, saw the most residential building permits issued in 2014? In this version I streamline the analysis by using a data processing “pipeline” and then graph the results.
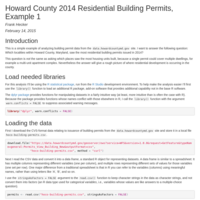
Howard County 2014 Residential Building Permits, Example 1
This is a simple example of analyzing building permit data from the data.howardcountymd.gov site. I want to answer the following question: Which localities within Howard County, Maryland, saw the most residential building permits issued in 2014?