ials2un
Ivan Lizarazo
Recently Published

Get time series of Sentinel-2 imagery
This notebook uses rstac and gdalcubes to obtain and process data from a STAC catalog

Accessing Sentinel-2 imagery
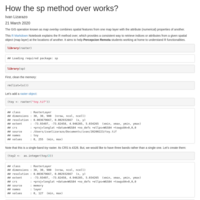
How to get Sentinel-2 imagery from MPS.

Estimation of vegetation properties
This notebook illustrates how to estimate vegetation properties from Sentinel-2 data using PROSAIL hybrid inversion.

Simple features in R
The *sf* R package provides support for working with the simple features (sf) standard for geographic vector data representation within the R ecosystem. This notebook illustrates a few GIS functionalities within the *sf* package empowered with *tidyverse* packages.

Document
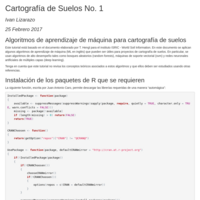
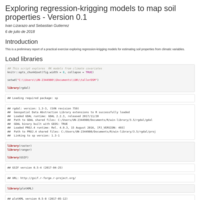
This notebook illustrates two spatial interpolation techniques: Inverse Distance Weighted (IDW) and Ordinary Kriging (OK). Both techniques are used here to get a continuous surface of soil organic carbon (SOC) from samples obtained from SoilGrids.

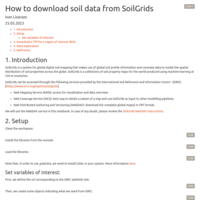
How to download SoilGrids data
This notebook illustrated how to download SoilGrids raster data using R. The process is illustrated using soil organic carbon stock as variable of interest. Obviously, the code can be replicate using a differnt variable.

Geomorphometric terrain attributes
This notebook illustrates how to calculate geomorphometric terrain attributes from gridded digital elevation models

How to get elevation data?
This notebook illustrates several functionalities to obtain, process and visualize digital elevation models (DEMs) in R.
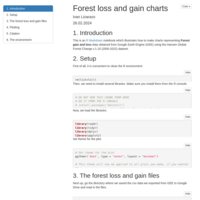
Charting forest gain and loss
As it reads.
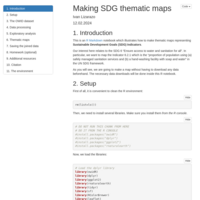
Making SDG thematic maps
An R notebook illustrating map making code for the MP164 course.
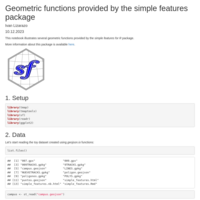
Geometric functions for simple features
This notebook illustrates several geometric functions provided by the *simple features for R* package.
Again EVA
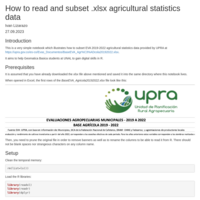
How to read and subset xlsx data.
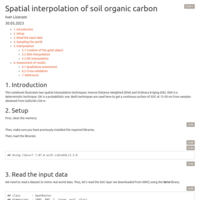
Spatial interpolation of soil organic carbon
This notebook illustrates spatial interpolation using IDW and Ordinary Kriging techniques.
How to get raster soil data from ISRIC
A notebook illustrating how to use the gdalUtils library and the WebDAV protocol to get soil raster data from a given geographic area.
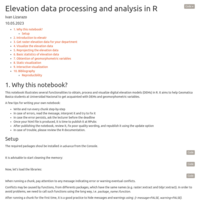
Elevation data processing and analysis in R
This notebook illustrates several functionalities for obtaining morphometric variables from digital elevation models.
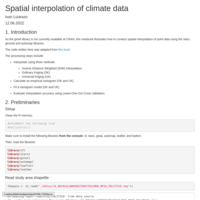
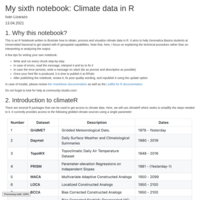
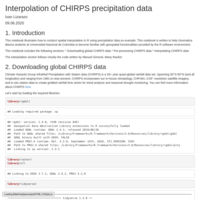
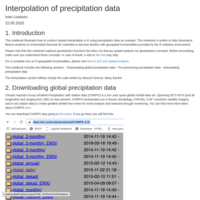
Spatial interpolation of climate data
This notebook illustrates how to conduct spatial interpolation of point data using the stars, geostat and automap libraries.
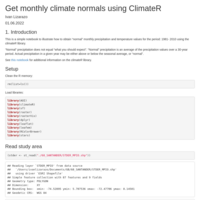
Get monthly climate normals using ClimateR
A simple notebook for GB2022 students.
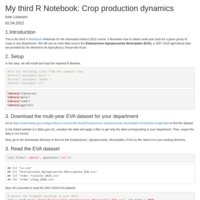
Crop production dynamics
This notebook illustrates analysis of multi-year agricultural stats.
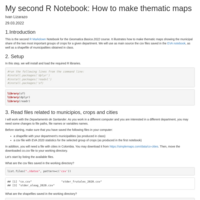
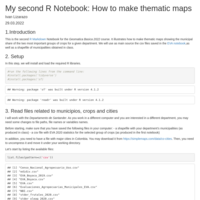
How to make thematic maps - V2
This notebook illustrates how to make thematic maps showing production for two important crops in a department.
GB2022 - Notebook2
It describes how to make thematic maps showing major crops in a given department.
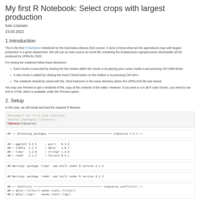
GB2022 - Notebook1
It descibes how to select crops with largest production from the 2020 EVA dataset.
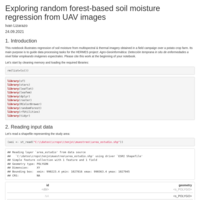
Exploring random forest based regression of soil moisture
A notebook to guide image analysis tasks in the HERMES project.
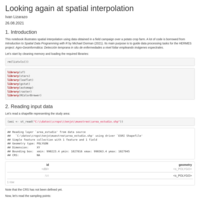
Looking again at spatial interpolation
Testing the gstat & stars alliance.
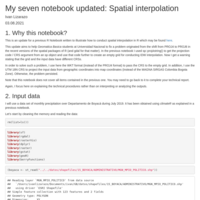
Spatial Interpolation revisited
This update aims to fix a problem originated from the shift from PROJ4 to PROJ6 in the recent versions of the rgdal. In this notebook I use the WKT format instead of the PROJ4 to get the CRS.

Healthcare accessibility and population
Another proof-of-concept.
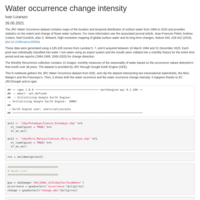
Water ocurrence change intensity
A proof-of-concept.
Getting climate data from R
This notebook illustrates how to obtain and visualize global climate data in R.
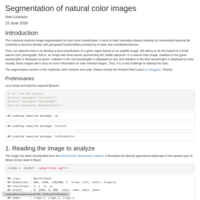
A tutorial on pixel-based land cover classification using random forests
This notebook illustrates land cover classification from multispectral imagery using the package ranger which is a fast implementation of random forests.
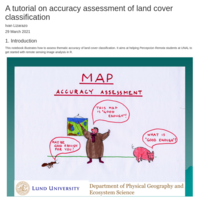
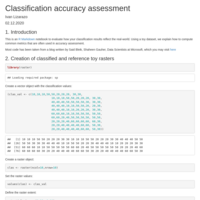
Accuracy assessment of land cover classification
This notebook illustrates how to assess thematic accuracy of pixel-based land cover classification using different metrics.
My fifth notebook: elevation data
This R Notebook illustrates several functionalities to obtain, process and visualize digital elevation models in R.
CART-based land cover classification
This notebook illustrates how to conduct land cover classification from multispectral imagery using the terra library.
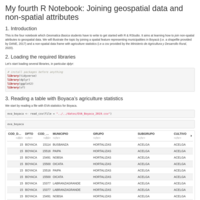
Joining attributes to spatial features
This is the fourth notebook that GB students need to write to get started with R geospatial capabilities.
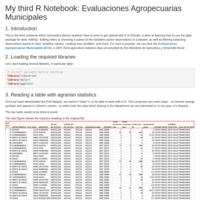
Evaluaciones Agropecuarias Municipales
This is the third notebook that Geomática Básica students have to write to get started with R & RStudio.
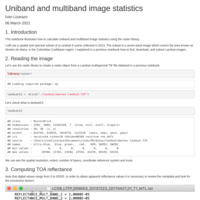
Image statistics of a Landsat 8 image
This notebook illustrates how to calculate uni-band and multi-band statistics of remote sensing images using the raster library.
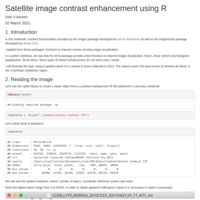
Satellite image contrast enhancement with R
This notebook illustrates how to improve image visualization of remote sensing images (when traditional contrast stretch techniques are not good enough).
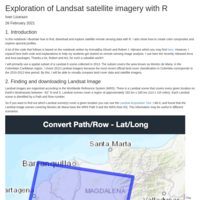
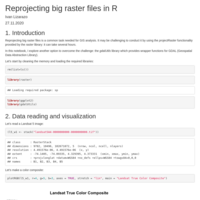
Landsat image exploration with terra
This notebook illustrates how to read, visualize and explore Landsat satellite images using the terra package.
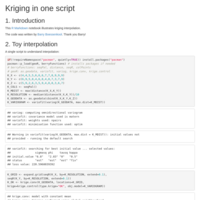
Kriging made simple
This notebook illustrates kriging interpolation using code written by Barry Boessenkool.
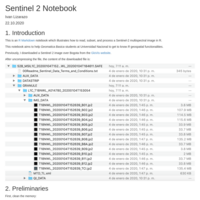
Sentinel-2 in R
This notebook illustrates how to read, subset and process Sentinel-2 data in R.
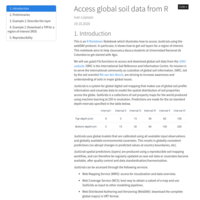
Access global soil data from R
This is an R Markdown Notebook which illustrates how to access SoilGrids using the webDAV protocol.
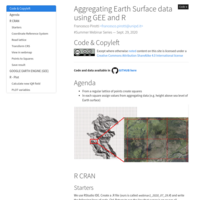
Aggregating Earth Surface data using GEE and R
Author: Francesco Pirotti <francesco.pirotti@unipd.it>
#Summer Webinar Series — Sept. 29, 2020
Accessing elevation data from R
This notebook illustrates how to use the elevatr package for getting raster elevation data.
Leaflet mapping using simplified geometries
This notebook illustrates how to simplify simple features geometries in order to produce lightweight files, and thus, be able to publish leaflet maps in RPubs.
Getting started with Leaflet maps
This is a workaround to "publish" maps when uploading the html to RPubs is not possible.
Leaflet - Part1
This notebook creates a leaflet map from a table of points

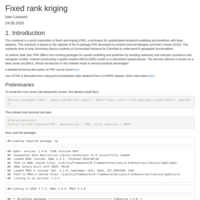
Fixed Rank Kriging
A quick exploration of FRK.
Spatial Interpolation
This notebook illustrates spatial interpolation using precipitation data as example.
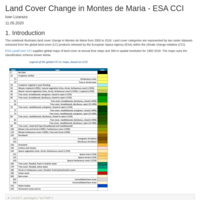
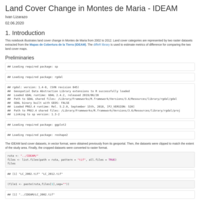
Land Cover Change Metrics [2]
A notebook to explore land cover change using the ESA CCI Land Cover Product
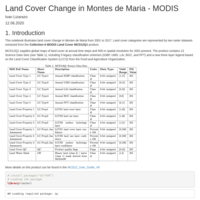
Land Cover Change Metrics
A notebook to explore land cover change using the MODIS Land Cover Product
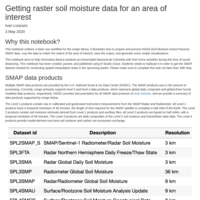
Get Soil Moisture Data from R
Illustration of functionalities provided by the R library smapr.
Thematic cartography in R
This notebook illustrates functionalities provided by the cartography package
Exploring and mapping agricultural statistics
An R notebook to illustrate geomatic concepts useful in agronomy.
Getting, processing and visualizing elevation data
This is an illustrative R notebook aimed to help GB students at UNAL with their home activities during this social distancing's time.
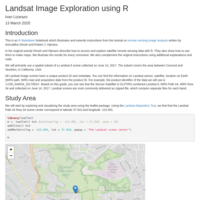
Landsat Image Exploration
This is an R Notebook based on the tutorial Remote Sensing Image Analysis with R written by Aniruddha Ghosh and Robert J. Hijmans. It covers the exploration section.
Texture Metrics 2
This notebook explores principal component analysis of textural metrics
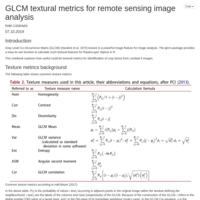
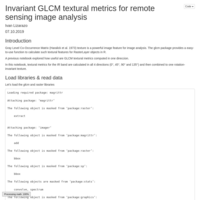
Texture Metrics 1
This notebook explores texture metrics.
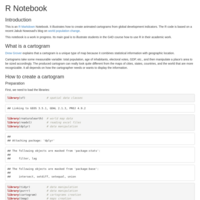
Illustration of an animated cartogram
This notebook uses a 1993-2015 time series with the undernourished population percentage by country and population data for producing cartograms showing number of people severely affected by food insecurity.
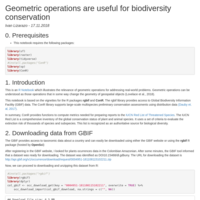
Useful geometric operations
Illustration of a meaningful set of convex hull, alpha hull and buffer operations.

Women in the world - No. 1
A proof-of_concept on women and gender inequality
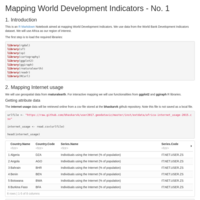
Mapping World Development Indicators
A guide for mapping development indicators using World Bank data.
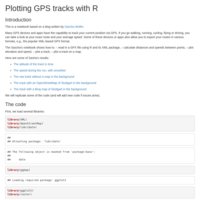
Reading and plotting GPX with R
There are several options to read, transform, and display point and track data stored in GPS Exchange (GPX) format using R. This notebook shows one of them.
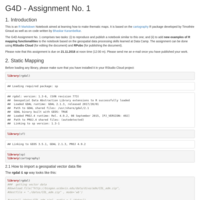
G4D - Assignment No. 1
Here you find detailed instructions to write your own notebook.
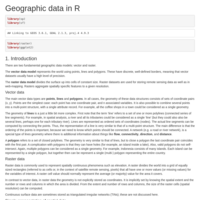
Geospatial data in R
A synthesis based on rspatial.org
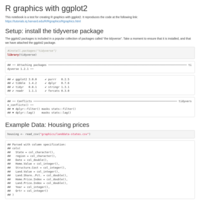
Making basic graphics in R
As said.
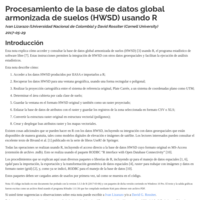
Procesamiento de la base de datos global armonizada de suelos (HWSD) usando R
Esta nota explica cómo acceder y consultar la base de datos global armonizada de suelos (HWSD) [3] usando R, el programa estadístico de software libre [7].
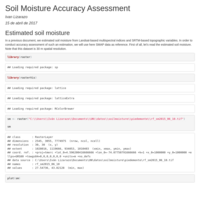
Soil Moisture Accuracy Assessment
This document evaluates accuracy of soil moisture estimated from remotely sensed data. A SMAP Level 3 dataset is used as reference.
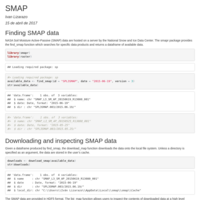
SMAP data
This document describes how to search and download NASA SMAP data.
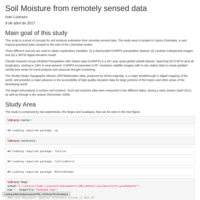
Surface Soil Moisture from Remotely Sensed Data
Proof of concept to estimate surface soil moisture from topographic and multispectral índices.
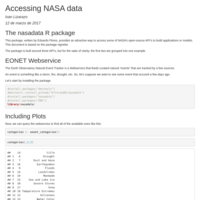
Accessing NASA data
A brief overview of the nasadata package functionalities
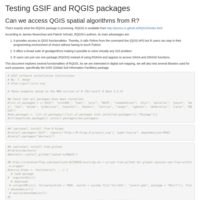
Testing GSIF and RQGIS packages
This is a simple test of a few geospatial functionalities