
RamyaEmandi
Ramya Emandi
Recently Published
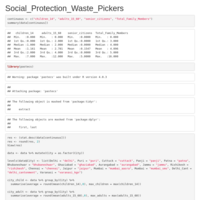
Social Protection for Waste Pickers
Most of the data variables are categorical along with few continous variables, the scope for modelling is limited. However, odds ratios were established using ordinal, logistic, multinomial regressions.
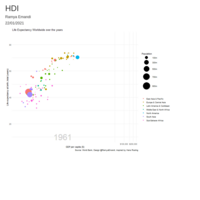
Life Expectancy Animated Graph inspired by Hans Rosling
data retrieved from wbstats
Usage of gganimate, ggplot2, dplyr
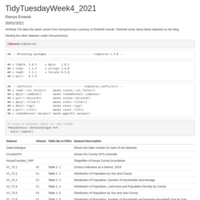
TidyTuesdays 2021 Week 4
rKenyaCensus
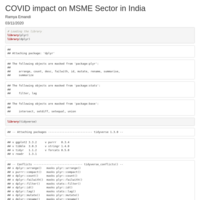
COVID impact on MSME Sector in Karnataka, India
ANOVA | Ordinal | Logistic Regression
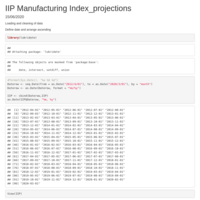
SARIMA Model for predicting Manufacturing Index
The manufacturing index is the biggest component of the general index of production as it makes up 77.63% of the general index. The data for IIP and its components (Manufacturing Index) is sourced from MOSPI which contains monthly frequency from April 2012 to March 2020.
As the model has shown seasonal variations, the prediction model detected is SARIMA (0,1,1) (2,0,0) [12]. The months of Apr to September are predicted.
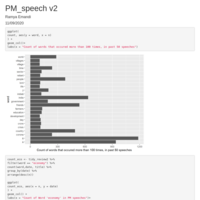
PM Speeches Sentiment
NLP textual analysis -
"The importance of Economy is analysed over time by counting the number of times "Economy" appeared in PM's speeches. This is for past 50 speeches."
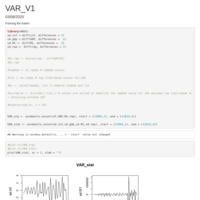
VAR Model for 4 Variables - GDP, Inflation, M1, Repo Rate
Projected next four quarters (Q1 2020 to Q4 2020) for GDP, Inflation, M1, Repo Rate using VAR model due to their inter-dependencies. Lag selected is 3 as per BIC criterion.
Unique to this R code - Many of the R codes available online, the following step of de-difference is not performed.
To attain stationarity the series are differenced twice. Hence to forecast to original series, the stationary series has to be de-differenced twice to retain to its originality (This is to be done, as the original series was differenced twice to make it stationary and the projections are for the stationary series). I need to de-difference the forecasted stationary series twice to its original form to get the corresponding forecasts.
Note : Q1, Q2, Q3 & Q4 denote - January to March, April to June, July to September and October to December quarters, respectively.
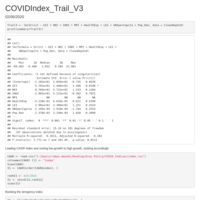
COVID Index Vs HDR (Version3)
An index of stringency, CAGR and testing per population is formulated and then tested for their relation to independent variables of human development.
COVID Index Vs HDR (Version2)
Stringency Index is considered as a independent variable and CAGR of covid cases as a dependent variable.
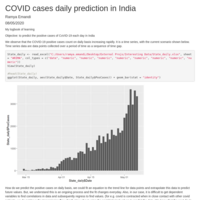
COVID cases daily prediction in India using ARIMA time series model
My logbook of learning
02/05/2020 to 08/05/2020
Started with survival analysis, and transitioned by study to ARIMA models due to the shortcomings of SA data availability. Worked on R and R Markdown to publish this, want to explore Shiny Web App as well.
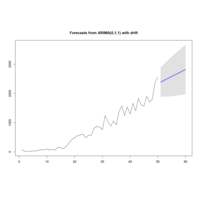
Plot_Predictions
Covid (positive cases each day) prediction in India. Predicted for May 3 to May 12 - 10 days