
dblalex
Alexandros Alexiou
Recently Published

Introduction to R Shiny II
Prepared for the MSc in Health Data Science, University of Liverpool

Trends in life expectancy and inequalities in England
Lecture for the Epidemiology and Statistics for Public Health II - Public Health Data Lab module; Master of Public Health, Dept. of Public Health, Policy and Systems, University of Liverpool
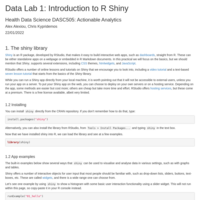
Introduction to R Shiny I
Prepared for the Health Data Science MSc, University of Liverpool
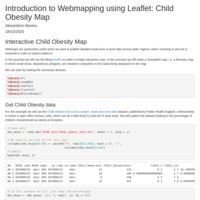
Introduction to Webmapping using Leaflet: Child Obesity Map
In this practical we will use the library leaflet to make a simple interactive map of child obesity measures by neighbourhoods in England. In this scenario we will make a choropleth map, i.e. a thematic map in which small areas, depicted as polygons, are shaded in proportion to the value being displayed on the map.

Public Health Data Lab II
MPH - Dept. of Public Health Policy and Systems. University of Liverpool .
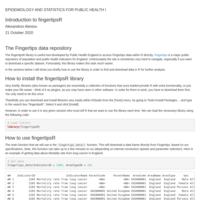
Introduction to fingertipsR
A brief guide on how to use the fingertipsR package to access the Fingertips data repository from Public Health England.

Life Expectancy Inequalities in England
In this study we will examine how life expectancy at birth (LE) in England has evolved since 2001-03. We will also focus on the inequalities of LE among local authorities, and in particular on inequalities that are associated with deprivation or sex. Besides some descriptive analysis, we will also try to build a very simple regression model describing the relationship between life expectancy and gross disposable income at the Local Authority (LA) level.
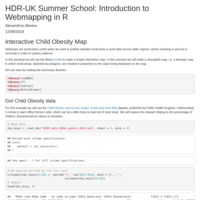
HDR-UK Summer School: Introduction to Web-mapping in R
A short introduction to web-mapping in R using the leaflet package. In this example we make a choropleth map of English MSOAs based on Child Obesity data at reception.
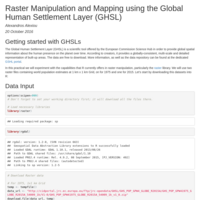
Raster Manipulation and Mapping using the Global Human Settlement Layer (GHSL)
In this practical we experiment with the capabilities that R offers in raster manipulation, particularly the raster package. We will use two raster files containing world population estimates at 1 km x 1 km Grid, one for 1975 and one for 2015.
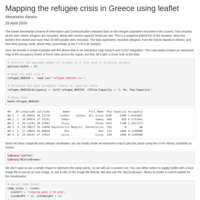
Mapping the refugee crisis in Greece using leaflet
Here we provide a simple example with data regarding the refugee population in Greece in an interactive map using the leaflet library. The code describes step-by-step how to create an interactive map of the refugee camp sites across the region, categorised by their occupancy levels.